
The California Voters' Experience
The California Voters’ Experience
What Works for Them, What Does Not Work, and Where to Go From Here
by Kim Alexander,
President & Founder, California Voter Foundation
Prepared at the request of California Forward
October 29, 2008
Table of Contents
Part I: Current Statistics, the Metrics Problem, and the Incentive Problem:
Current Participation Statistics:
The Metrics Problem:
What is “good enough”?:
Which strategies are effective?:
The Incentive Problem:
Part II, The Voters’ Experience: Registration, Preparation, Voting, and Results:
1. Voter Registration:
The voter registration form:
Local outreach in counties:
Registration by parties and campaigns:
Registering at the DMV:
Internet-assisted registration:
Verifying voter registration status:
The potential for online voter registration:
Other potential voter registration changes: same-day and automatic registration:2. Preparing to Vote:
Getting informed:
Skipping contests on the ballot:
Voter and civic education in California schools:
Deciding on a voting method:3. Voting:
Voting at the polling place:
• Voting equipment:
• Polling place location and signage:
• Poll workers:
• Poll worker training reform efforts, 2004 – 2008:
• Poll worker training guidelines, 2006:
• State Auditor’s report, 2008:
Voting by mail:
Returning a vote-by-mail ballot to a polling place:
Voting early at the county election office or an early voting site:
Other kinds of balloting – military/overseas voters:
Primary elections in California:4. Results: 28
Online election results:
Verifying the vote:
• Post-election manual counts:
• Provisional ballot verification:
• Vote-by-mail ballot verification:
• Polling place ballot verification:
Long-term election results:
Part III, Structural Impediments to Change:
The Digital Divide:
The Staffing Issue:
Part IV, Ideas for Moving Forward:
The need for uniformity and standardization in election practices and procedures:
Establishing a voter participation goal:
Constituencies, organizations and individuals to involve in further discussions to improve voter participation in California:
Topics for further research:
Acknowledgements:
California Voter Profiles (PPIC chart):
![]()
“(We are) in an election system that has evolved since the beginning of our history as a country in a way that we probably would not design if we were to design it today.”-- California Secretary of State Debra Bowen,
testifying to the Legislature about problems voters faced
in the 2008 Presidential Primary election,
Los Angeles, March 7, 2008
This is the first, comprehensive look at voting in California from the voter’s perspective. In recent years and for many reasons California voters have been unhappy with their voting experience, from start to finish. There is also disappointment with the steps government agencies at the federal, state, and local levels have taken to facilitate voting. A thorough examination of what works in the voting process, what does not work, and where to go from here to develop and implement a reform consensus is long overdue. This paper is a first important step toward problem diagnosis and should lead down the road to change, from top to bottom of the system.
Since many structural factors shape the California voting experience, as well as voting outcomes in state and local elections, such as news coverage, campaign spending, and redistricting, it is also important to say that this paper is rather sharply focused on the mechanics of the voting process and on the roles in that process of voters and government agency staff. These are the most neglected parts of the system and the ones least well represented in previous work on how and why Californians vote as they do.
The paper is divided into four parts.
Part I looks at recent voter registration and participation statistics for California and describes some of the major challenges faced in efforts to improve voter participation.
Part II follows voters through their voting experience, step by step, from start to finish, and at each step points out strengths and weaknesses of the overall system from the point of view of voters.
Part III identifies key structural impediments to change.
Part IV discusses ideas for moving forward, including constituencies to involve in further discussions and topics needing additional study.
Part I: Current Statistics, the Metrics Problem, and the Incentive Problem
Current Participation Statistics
According to the Secretary of State’s September 5, 2008 Report of Registration:
-
23,171,364 Californians are eligible to vote;
-
16,171,772 Californians are registered to vote (70 percent of eligible voters);
-
7,101,442 eligible Californians are not registered to vote (30 percent).
Voter participation rates vary dramatically from election to election. Here are the turnout numbers for the past seven statewide elections in California:
| Election | Number of Voters |
Turnout/registered % |
Turnout/eligible % |
| March 2004 | 6,684,421 |
44 |
31 |
| November 2004 | 12,589,683 |
76 |
57 |
| November 2005 | 7,968,757 |
50 |
35 |
| June 2006 | 5,269,142 |
34 |
23 |
| November 2006 | 8,899,059 |
56 |
39 |
| February 2008 | 9,068,415 |
58 |
40 |
| June 2008 | 4,550,227 |
28 |
20 |
While turnout in general elections can sometimes reach fairly high levels among registered voters, particularly in presidential contests, the contrast between turnout in primary and general elections is striking. An important voter registration trend accounting for some of the low turnout in primary elections is the increasing number of Californians who are not affiliated with any political party. The purpose of a primary election is to select party nominees for the general election, and the nearly 20 percent of all California voters registered as nonpartisan and independent have less interest in this process than those who register by party.
Any way you look at it, however, there seems to be lots of room for improvement in voter participation in California elections.
The Metrics Problem
-
What is “good enough”?
Does California have, however, an established goal or guideline for voter participation in elections, some benchmark against which to assess whether voter turnout is healthy or not?
There is no such measure. In some large and philosophical sense low voter turnout signals that all is not well with democracy. But there are no consequences for anyone when voter turnout is deemed or perceived to be poor – not for candidates, not for election officials, and not for voters. Judgments about whether turnout in a particular election is high or low are, therefore, vague, relative, and based on little more than informal assessments of how turnout compares to what it was in a recent, similar election.
If there were to be voter turnout goals established for elections in the state and incentives created for the people who organize and conduct elections to meet these goals, these are some of the questions to ask:
-
What are the average and median county-by-county registration and turnout rates gauged against the pool of eligible voters?;
-
What has been California’s turnout rate over the past 20 years and what is the average and median?;
-
How do California’s voter registration and turnout rates compare to those of other states and to the national average? To those of other democratic countries?
-
How do the demographics of California’s electorate match up against those for the state’s total population? And how representative, therefore, in demographic terms is the electorate?
Answers to these questions would be useful starting points for expressing statewide turnout goals in relation to both eligible and registered voters.
The question of what level of turnout is “good enough” goes to the legitimacy of elected governments – what level of electoral participation can sustain claims by elected leaders that they are legitimate representatives of their people both at home and in the world? One potential but minimal answer to this question is that leaders were elected by “50 percent plus one”, i.e., at least 50 percent of eligible voters took part in an election.1
A more challenging way to approach the metrics problem is to compare the demographics of California’s voters to those of the state’s total population. Here, the primary concern is less with how many people vote and more with the degree to which those who do vote are a reflection of the population as a whole. In the past, this is the concern that has fueled efforts to increase turnout among targeted sub-groups of Californians currently or traditionally under-represented in the electorate. As the Public Policy Institute of California (PPIC) put it in an August 2008 report:
“Although whites represent less than a majority (47%) of California’s adult population, they constitute 70 percent of likely voters. Despite the fact that Latinos represent about one-third of California’s adult population, they constitute only 15% of likely voters and 64 percent of those not registered to vote. Asians also make up a lower proportion of likely voters than their share of the population (6% vs. 13%). Blacks make up both 6% of the population and likely voters.” 2
Other data from PPIC underline racial disparities between California’s likely voters, registered voters, and nonregistered voters:
| Race | Registered | Not registered | Likely to Vote |
Not Likely to Vote |
| Latino | 49 |
51 |
26 |
74 |
| White | 89 |
11 |
72 |
28 |
| Black | 85 |
15 |
58 |
42 |
| Asian | 69 |
31 |
42 |
58 |
(source: PPIC)
PPIC has also documented the propensity for likely voters to be older and more affluent than nonregistered Californians (see chart at the end of this report).
Data such as these, taken together with what we know about basic demographic trends in the state, contribute to the probability that California’s elected leaders will be more concerned about and attentive to the interests of that limited sub-set of the overall population that actually votes than with representing a much broader public interest. The only effective, long-term way to correct this bias in state public policy outcomes is to increase the diversity as well as the number of Californians who participate in the voting process.
Efforts to increase turnout, thus, may focus on young, low-income, Asian, and Latino Californians. The more California’s population grows younger and more diverse, the more troubling it is that California voters are predominantly old and white.
To put California voting turnout in context, the 2006 Census report on voting and registration shows that approximately 48 percent of California’s voting age population voted in the November 2006 election.3 This puts California slightly below the U.S. average and 29th among the states.
The Census Bureau’s methodology for calculating the “voting age population” in a state such as California is, however, controversial. California is a state where many residents are not citizens and are, therefore, not eligible to vote.4 It is misleading, then, to compare California with states where residents have much higher rates of citizenship. We ought not to compare California’s turnout to that of other states as a basis for evaluating and perhaps improving voter participation without first carefully examining the way the Census Bureau calculates the number of residents in a state who constitute the voting age population.
These challenges in thinking about the metrics of voting do not to detract, however, from the desirability of setting voter turnout goals that are reasonable and attainable and using these as first steps toward tackling the turnout problem.5
Arguably, in an ideal world turnout would be at or very close to one hundred percent of eligible voters at every election. As a practical matter, such a goal is unattainable. We know that turnout varies depending on the type of election and is likely to be higher in Presidential general elections than in state primaries. To take these realities into account, turnout goals could be set based on historic performance, although setting goals for the state as a whole or for individual counties in California would also need to factor in the reality that California’s population, and its corresponding pool of eligible voters, is ever-increasing. Simply sustaining a level of turnout reached in past elections would still lead to an increase in the number of voters.
For example, if California were to sustain the turnout level in the November 2004 Presidential election, when 76 percent of registered and 57 percent of eligible voters voted, the total number of participating voters in the November 2008 Presidential election would increase by 540,000 to 13.1 million.
-
Which strategies are effective?
Another metrics challenge stems from the difficulty in knowing whether or not and, if so, by how much a particular effort or activity aimed at increasing voter turnout actually makes a difference.
When an occasional voter votes, or a first time voter registers and votes, a number of factors may have influenced that decision. The sorts of voter outreach programs traditionally favored by governmental agencies, foundations, and volunteers may have been a factor. If that was the case, agencies, foundations, and volunteers would certainly like to know. But word of mouth, family ties, and other serendipitous factors also play a role in voting decisions and traditional outreach programs rarely address these.
Some promising research is being conducted in this area by the “California Votes” initiative, sponsored by the Irvine Foundation. In a September 2007 report on research into effective outreach and mobilization strategies among California minority and low-income communities,6 the project found that “mobilizing voters in low-propensity communities requires some form of live conversation, whether in person or on the phone. The features required to make this conversation successful merit further exploration.” 7
The Incentive Problem
Efforts to increase voter participation in elections and to improve the experiences voters have throughout the entire voting process are also confounded by the incentive structure that faces election officials.
Higher turnout comes at higher cost in an elections and voting system that is already stretched thin. A higher number of registered voters means more polling places must be in operation, since state law requires a maximum of 1,000 registered voters per precinct. Higher turnout will also likely mean longer wait times for voters at polling places, especially if it is an election with a long and complex ballot. And this in turn means greater opportunity for security and procedure breaches.
In this context, the incentives election officials have to increase turnout and to accommodate that increased turnout, if it occurs, are unclear. If higher turnout means more work and expense for election officials, the rational strategy is to accommodate something close to the turnout that occurred in the last, similar election.
During the very closely contested 2004 presidential election in Ohio, candidates and parties had great incentive to increase registration and turnout, but when their efforts succeeded election officials did not have the capacity to handle the consequences. Voters waited in line for hours, some in the rain, to get their chance to vote. As Cleveland Ward 7 councilwoman Fannie Lewis put it in the voting documentary “No Umbrella”, when asked how things went at her local polling place in November 2004, ”It’s like we prayed for rain and didn’t bring no umbrella.”
The incentives political campaigns have to encourage voter turnout are also mixed. In some circumstances, greater turnout can mean a greater chance of winning. But reaching more voters means sending more campaign mail, knocking on more doors, and making more phone calls. Keeping turnout low can, therefore, be a way of keeping down outreach costs.
Moreover, in circumstances where intensely competitive campaigns are waging a war of attrition, the value of a dollar spent on increasing overall turnout may be far less than that of a dollar spent on getting more votes than an opponent at the margin. And, if the search for a margin of victory leads to the adoption of negative campaign tactics, the net effect may be to suppress turnout, rather than increase it, either overall or at the margin.
When campaigns do make outreach efforts, they generally do it on the basis of what they know about how voters have participated in previous elections. What this means for first-time or occasional voters is that they are unlikely to be contacted by campaigns, and that campaign outreach will have no positive effect, therefore, on their probability of voting. A reliance on campaign outreach efforts to court first-time or occasional voters is quite simply misplaced.
The fact that both election officials and political campaigns have little incentive to encourage high levels of participation in voting poses a fundamental problem for California. It is also both ironic and unfortunate that even as occasional and first-time voters are drawn to participate in high profile elections their increased participation puts a strain on polling places, results in confusion and delays, and potentially creates a negative voting experience.
Part II: The Voters’ Experience: Registration, Preparation, Voting, and Results
1. Voter Registration
Why do some people register to vote and others do not? A California Voter Foundation (CVF) survey conducted in 2004 and published in 2005 shed some light on the barriers and incentives for voter participation in California.8 CVF surveyed 1,000 infrequent voters and 1,000 nonvoters, the latter defined as Californians who were eligible, but not registered to vote. Among some of the surprising findings relating to voter registration:
-
29 percent of nonvoters said they did not know where to find voter registration forms;
-
23 percent said they did not register because they wanted to keep their personal information private;
-
44 percent said they had been registered before but not at their current address; and
-
18 percent said they thought they were registered through the Department of Motor Vehicles (DMV).
In order to vote, a Californian must first register. State law also requires voters to reregister whenever they move, change their name, or wish to change their party affiliation. In order to be eligible to vote, a Californian must be:
-
a U.S. citizen;
-
18 years of age by the next election; and
-
not imprisoned or on parole for a felony.
These restrictions are listed on the state voter registration form. Anyone who has been declared incompetent by a court is also ineligible to register or vote.
The voter registration form
The voter registration form now in use was redesigned and simplified in 2008. The improvements included removal of the instruction section and an overall reduction in the number of words on the form from more than 1,200 to about 730. The option not to provide information for some specific fields of the form, such as phone number and email address, is now explained in the field itself, instead of being buried in fine print at the bottom of the page. And the political party selection section makes it clearer to voters how to register as a nonpartisan voter.9
The improved form does not eliminate, however, all potential sources of confusion voters confront when trying to register. In addition to a statewide form with the Secretary of State’s return address on it, each one of the 58 counties also has its own registration form with the county election office’s return address. In addition, unique forms are printed for a number of different state programs with varying return addresses.10
Although the state form is typically found in public buildings, such as libraries and post offices, there is no guarantee that every library or post office will have a good supply of voter registration forms on-hand, or a clear routine to restock the supply with the most recently revised form. This is because there is no policy requiring that forms be available in public offices. They are provided by convention as a service and the quality of service varies appreciably from county to county and from post office to post office. Postal regulations govern the display and availability of various materials inside post offices but do not require that an adequate supply of up to date voter registration forms be among them. Would-be voters can, therefore, go in search of forms in obvious public places and find a supply that is depleted or out of date.
Local outreach in counties
To see how this situation plays out at the local level, consider the case of Sacramento County, where supplying voter registration forms in post offices, libraries, and firehouses is a component of the voter outreach plan, required in this county and others by law11 and transmitted to the Secretary of State on a yearly basis.
Sacramento County contracts with the League of Women Voters to check 50 locations in the county every three months and ensure an adequate supply of forms. Even with this fairly well-crafted plan, however, there are hitches. When the county Registrar of Voters found that the voter registration form bin at her local post office was empty she contacted the League of Women Voters, who in turn contacted the post office staff, who duly reported that the bin was full, and this was reported back to the Registrar. However, when the Registrar again went to the post office she found the bin empty. This time she asked the post office staff for an explanation, which was that actually there were two bins – one in the outer lobby and one in the interior lobby. One was full and one was empty. She also discovered that the post office had a stack of 50 blank forms behind the counter but staff members were uncertain what to do with them.
Registration by parties and campaigns
Some voters complete registration forms with assistance from political campaigns or parties. People are often approached in front of stores or other public places and encouraged to register, and often to sign initiative petitions as well. The conventional wisdom is that the priority for these third party paid canvassers or ad hoc registrars is to get signatures on initiative petitions and that they are much less willing than they should be to complete the section of the voter registration form dealing with third party assistance, although data on this are scarce. The lack of this third party information means that, if there is a problem processing a form for a would-be voter, there is no accountability for the error. Election officials do frequently receive complaints from voters who have been registered or re-registered by paid registrars, with some voters claiming, for example, that their party affiliation or vote-by-mail status was entered incorrectly on the form without their knowledge.12
Registering at the DMV
Voters can also register to vote through the Department of Motor Vehicles (DMV) at the same time they apply for a driver’s license. However, the procedure used in DMV offices for this purpose apparently confuses many would-be voters. In 2004, when the California Voter Foundation surveyed 1,000 eligible, nonregistered Californians, 18 percent said that they thought they had been registered to vote through the DMV. If this level of breakdown in the DMV registration process were projected to the entire pool of 7.1. million Californians who are unregistered but eligible to vote it would exclude more than 1.27 million voters from the electorate. There is no way to know, of course, how many of this 1.27 million an improved DMV process might actually have registered, but the failure rate among the CVF sample is not an encouraging statistic.
Internet-assisted registration
Californians can also use the Internet to obtain or complete a voter registration form. There are problems here too, however, because two different forms are available online at the Secretary of State’s Web site.13 Under one option, to download and complete a voter registration form online, the form used is the federal Universal Voter Registration Form, which does not look like or have the same data entry fields as the California form. A person selecting this choice downloads the federal form onto their computer, completes it on the computer, prints it, signs it, and then mails it either to the Secretary of State or the local county registrar. The second option is to “have a voter registration form mailed to you.” Here, the form is filled out online and submitted to the Secretary of State over the Internet. Later, the voter receives a printed version of the form in the mail, to be signed and mailed, again, this time to the county election office.
It is unclear why it is necessary to have these two different online-assistance methods, or why there is an option of returning a registration form to either the local or state election office. This variation is bound to cause confusion to some voters, who will understandably wonder whether it is better to use the state form rather than the federal form, and whether returning the form to the state or local office makes a difference in how quickly and accurately the registration is processed.
Verifying voter registration status
After a person registers or re-registers to vote, the county election office sends a “Voter Notification” card in the mail to verify that the registration form has been received and processed. It states whether this is a new or updated registration record and confirms the voter’s party status. The notification cards are printed by the Secretary of State and sent to county election offices. The statute relevant to this notification has no timeframe within which counties must send out the cards and there is, therefore, no statewide standard for when voters can expect to receive their notifications.
After the voter notification mailing goes out, subsequent registration cards are not sent. The only way a voter receives ongoing confirmation of his or her registration status is by receiving the official sample ballot pamphlet by mail from the county election office prior to an election. This method of confirmation can be hit and miss for voters. The sample ballot pamphlets are mailed about a month before an election but the registration deadline is two weeks before an election. So, if a voter who has moved since last registering fails to notice that a sample ballot pamphlet was not delivered to his or her current address, there is only a two week window for re-registration. And, if that narrow window is missed, the opportunity to vote is also missed.
Voters can call county election offices to check their registration status. The phone number for the office may be difficult to find, however, inasmuch as many voters do not know the name of the county in which they live. Moreover, finding the number in the phone book is complicated by the fact that there is no standard labeling or naming convention for county election offices in California. The chief election officer can be identified locally as the County Clerk, the Registrar of Voters, or as the Assessor-County Clerk-Recorder. Looking up the number in the government blue pages by topic can also be confusing. Sometimes county election offices are listed under Elections, sometimes under Voting, and sometimes under Voter Registration.
Some counties have provided ways for voters to verify their registration status online. In the November 2008 election season, twelve California counties offered voters online registration status look-up services.14 The best examples of this service are in counties that require voters to submit personal information in order to verify their status but do not display in the results any additional personal information beyond what the voter initially provides in the online query, thus protecting voter data privacy.
Using the example of Sacramento County, again, a local voter submits a street number, zip code, and birth date. The county web site then checks those three fields against a registration database and returns a message, if the voter is registered, confirming that “A voter registration was found for a person born 08/20/1977, with a street address number of 1234 in zip 95816 (your name and street is kept confidential to protect your privacy).”
While these online verification services are useful, they are not standardized and they are not available to all voters in all 58 counties in California. In the case of voters who phone counties to check their status, they may have difficulty getting through to someone in the county election office, depending on the county, size of staff, and workload. Many voters mistakenly call the Secretary of State’s office, which currently does not have the technology to tell voters their registration status and generally advises voters to contact their county election offices.
The potential for online voter registration
Online voter registration may be on the horizon. A bill to allow the Secretary of State to process registration forms online was passed by the Legislature (SB 381/Calderon) and signed into law by Governor Arnold Schwarzenegger in September 2008. Online voter registration through a statewide web site would reduce the burden on many voters of obtaining and completing a registration card locally by hand. Many younger people will likely find this method of registering attractive. Local election officials also like the idea of online voter registration on a statewide basis because it reduces the data-entry workload for local election staff as well as the potential for data-entry errors that might inadvertently result in a voter’s disenfranchisement.
Online voter registration developed and managed by the Secretary of State is not, however, a panacea. It will not benefit people who lack convenient access to the Internet. And there are numerous security, privacy, and inter-agency administrative issues that need to be addressed before online voter registration on a statewide basis could be successfully implemented, as is discussed in testimony provided by the California Voter Foundation at a December 2007 Senate Election Committee informational hearing.15
Other potential voter registration changes: same-day and automatic registration
There have also been discussions about the possibility of establishing a voter registration system in which all Californians who reach voting age are automatically registered to vote. Some have also suggested a system in which a California citizen who obtains a driver’s license is automatically in line to be registered to vote once he or she reaches voting age. Another change that has been discussed for California and is already available in some other states is same day voter registration.16
2. Preparing to Vote
Getting informed
Voters get election information from a variety of sources, primarily government agencies, political campaigns, the news media, and nonprofits. There are basically three kinds of election information voters need. One deals with the mechanics of the election -- polling place location, the vote-by-mail deadline, or a description of the voting equipment, for example. The second sort of information voters need is about the contests on the ballot. In addition to this “nuts and bolts” and contest-related information, voters must also feel motivated to vote by contextual information about why an election is important and relevant to them and why in a larger sense in a democracy voting matters.
The official election information produced and distributed in California by the Secretary of State (the Voter Information Guide) and the Sample Ballots produced and distributed to voters by county election offices are generally considered the most valuable sources of election information for voters.17
However, the fact that voters receive two official voting guides from two government agencies at different levels of government also likely creates confusion for some voters and potential voters. The two guides contain, for example, overlapping information about the same contests, but not about all the contests that will be included on a local ballot. When the Legislature places measures on the ballot very late in the political season, as it did in 2008, a supplemental Voter Information Guide can also mailed out by the Secretary of State, and this likely adds to voter confusion.
When it comes to deciding how to vote, the news media play an important role. Voters also turn to friends and family for election opinions. The voter participation study CVF released in 2005 found that for infrequent voters, family members are as influential as newspapers when deciding how to vote.
Infrequent Voters: Most influential sources of election
information |
|
Local Newspaper |
65 % |
Conversations with Family |
65 % |
Network TV News |
64 % |
Cable TV News |
60 % |
Conversations with Friends |
59 % |
Source: California Voter Foundation, California Voter Participation
Survey Report (2005) |
|
This same CVF survey also found that infrequent voters and nonvoters do not feel they lack access to election information. The more salient problem comes from comprehending and trusting the election information they do receive. Among infrequent voters, 49 percent said election information is hard to understand and 29 percent said it is untrustworthy. Among nonvoters, 39 percent said it is hard to understand and the same percentage said it is untrustworthy. CVF concluded from these findings that leveraging friends and family to reach out to, motivate and educate potential voters can help increase turnout.
To follow up this finding, CVF and the Commonwealth Club of California developed the Election House Parties project in 200518 to promote small, informal gatherings to educate and prepare voters to vote. A post-election analysis of survey results from 33 election house party participants found that one-third reported they were more likely to vote after attending an election house party and 55 percent said they voted on more contests, rather than skipping them, because they participated in an election house party.
Skipping contests on the ballot
Infrequent and first-time voters often find voting challenging, particularly when there is an array of choices to make on a number of topics with which voters are unfamiliar. In this context, skipping a contest when marking a ballot is a sensible choice and one frequently made by voters. There are usually, however, no instructions given to voters that skipping contests is an acceptable choice and the use of touchscreen voting machines can work against it.
Such machines are commonly programmed to prompt voters to “make a choice” when they do skip a contest, which may lead some voters to believe that if they do not “make a choice” on every contest their ballot will be invalid. Providing voters with information about the right to skip contests on the ballot, or adding an option on the ballot to “skip this contest” would make voting more attractive for some and encourage all voters to feel prepared to vote, even if there are some choices they have to forgo.
Voter and civic education in California schools
Whether Californians are prepared to be informed and engaged voters also depends to some extent on the scope and depth of civic education they receive as students. When advocates of greater voter participation and better voter education talk about why people do not vote, the lack of civics education in schools is often cited as a contributing factor. The extent to which civic education is provided across California’s many and diverse school districts, whether it needs a revised curriculum, and whether it should be given more attention in California schools are all controversial questions. They deserve further study, particularly given the widespread perception that the powerful unions representing teachers in California politics have not given these issues the priority they deserve.
Deciding on a voting method
The number of ways in which Californians can actually cast their ballots has changed over time. There are now more choices than there have ever been. This also means, however, that California voters have to decide which method of voting will work best for them. The choices are:
-
Voting at a polling place;
-
Voting by mail;
-
Returning a vote-by-mail ballot to a polling place; or
-
Voting early at the county election office or an early voting site.
For each of these options, the state and local laws and procedures governing how they work lack standardization. A voter’s experience with each and every one of these methods can, therefore, vary greatly from one county to another in the state.
The impulse to provide voters with different methods of voting stems from a conviction on the part of state policymakers that if they make voting easier more people will vote. This is why access to vote-by-mail balloting has been expanded, for example, and why policymakers have allowed for early voting and have established provisional voting rights.
On balance, these various initiatives probably have increased the convenience of voting. Their impact on turnout is uncertain, however, and any gains in that regard have to be offset against the increased difficulties election officials and voter outreach groups face in translating a variety of voting methods and a maze of associated complex rules into consistent and meaningful guidance to voters about how exactly to cast their ballots.
3. Voting
Voting at the polling place
A voter who wants to vote in person must show up on Election Day at his or her assigned polling place during the hours of operation, which run from 7 a.m. to 8 p.m. While voters’ correct polling places for each election are printed on their County Sample Ballots, many voters assume it is the same location as “the last time” and show up at the polling place they used when the last election was held. If the location of a polling place has, in fact changed and voters do not have their Sample Ballots with them, finding the new location and actually voting can be difficult.
The smooth operation of polling places can be complicated by several other factors. One of them is crowding, although state law requires poll workers to allow any voters standing in line to vote at the time the polling place closes the opportunity to cast a ballot. Variable requirements for voters to show identification can also be a problem. Under the federal Help America Vote Act, for example, voters who register to vote through the mail, which is now virtually all voters in California, must show identification the first time they vote at a polling place. In some states this would be interpreted to require photo ID.
A photo ID is not required under California law, however, and poll workers are instructed to accept a long list of various kinds of ID, including any government mailing, such as the county sample ballot. Indeed, an important part of poll worker training consists of teaching poll workers when ID is required for first-time voters and understanding the various forms of ID that are acceptable.
Though it can be administratively challenging to require some, but not all voters to show ID, most counties have managed this challenge well by simply printing a notation in the poll book identifying which voters are required to show ID if they show up to vote at a polling place. For first-time voters who choose to vote by mail and do actually exercise that option the return envelope for the ballot is itself a government mailing and as such meets California’s ID requirement. However, while counties are successfully meeting the HAVA first-time voter ID requirement, many voters are confused as to why all voters are not required to show ID.
-
Voting equipment
The voting equipment in use at polling places can also be a source of trouble for poll workers and of confusion for voters. In the last eight years, California has made very substantial changes in the ways it uses voting equipment. In the October 2003 gubernatorial recall election, for example, nearly half of the state’s voters lived in counties using pre-scored, Votomatic-style punch card ballots. By the March 2004 primary election, nearly half were using paperless, electronic voting machines. By 2008, 88 percent of voters were casting paper ballots with optical scan voting systems.19
Nearly every county also places one computerized machine in each polling place to provide unassisted ballot access to voters with disabilities. While all voters are entitled to use these machines if they wish, some counties discourage their general use by voters for administrative reasons.
Counties use a variety of voting machine models from several different vendors. Even in counties that share the same vendor, the equipment varies by make and model number. There are, therefore, unique procedures governing exactly how any given county’s voting machines are to be used and even though two counties may be using the same vendor and essentially the same equipment the voter’s actual experience with a voting system will vary depending on different local operating procedures.
Ballot layout styles also vary between counties, as do the marking methods for optical scan ballots. In some optical scan counties, voters fill in an oval with a marker. In other counties, such as San Francisco, they connect an arrow. In some counties, voters’ optical scan ballots are read and counted by a computer scanner at the polling place, while other counties tabulate ballots centrally, at the county election office. Electronic voting machine designs also vary; one company manufactures machines in which voters turn dials to make their ballot selections, while other manufacturers use a touchscreen interface.
-
Polling place location and signage
Polling places can be located in a variety of venues, such as schools, churches, firehouses, or even someone’s home or garage, and not all these locations are equally welcoming to different groups of voters. First-time voters, for example, may feel reluctant to vote at a polling place in the home of someone they do not know. Polling place locations can be hard to find, in part because some poll workers do a better job of placing signage than others.
Under state law, polling places are required to have three different exterior signs: a polling place sign, a 100-foot perimeter sign announcing that there is to be “no electioneering beyond this point”, and an American flag sign. However, there appears to be no standardization in the size, shape, material or method of display, such as using tape, cones, or a wooden post, for these several signs.
In 2006, then-Secretary of State Bruce McPherson implemented an election day observation program for the June and November elections in which dozens of staff members observed voting activities in multiple polling places across the majority of California counties. In both elections, signs and flags at polling places were noted as a common problem. In some instances the signage was not visible. In other cases required signs or flags were not displayed, often because limitations in the environment of physical polling places made it difficult or impossible to post a sign at all, or to post one in a spot visible from the street.20
-
Poll workers
It is clear from what has been said already that the experience California voters have as they participate in elections and especially in the voting process is influenced by a variety of factors. Some of these are technological, some are legal and procedural, and some stem from the levels of preparation voters themselves bring to polling places.
There is one other vitally important human factor to add to this mix, however, and it relates to the training and conduct of poll workers. Most experts on voting and elections would argue that, compared to all the other factors, the poll worker factor is far and away the most important.
Estimates are that in a California statewide election about 100,000 poll workers staff some 25,000 polling places across the state. Despite these impressively large numbers for the state as a whole, many counties experience chronic shortages of poll workers and in others, despite good recruitment, there are large numbers of “no-shows” on Election Day. These are the sorts of shortfalls that keep polling places from opening on time, in some cases for several hours, and lead to voters not getting the help they need in a polling place when they ask.
Some of the tasks involved in running a polling place are complex and difficult. Other tasks, such as tallying ballots at the end of the day, are routine and even dull. Poll workers themselves are a variable asset. They get different amounts of training using different sorts of training materials from one county to another, variables that are compounded by the quality of instruction.21 This lack of uniformity in poll worker training in California has obvious consequences for voters. The rules about voter identification, say, or the use of voting machines are enforced variably not just from county to county but also from polling place to polling place within a county. The potential dysfunctions associated with variations in the training of poll workers are exacerbated by the fact that elections are occasional rather than frequent events and the benefits of whatever training is provided are difficult to retain from one election to another.
The UC Berkeley Election Administration Resource Center (EARC) has conducted research into county poll worker programs and poll worker training since January 2005. It involves both direct observation of training programs in various counties and work in the polling places.22 According to a summary of this research:
We observed a tremendous amount of variation across counties in their training of election workers, even where they shared the same voting machines and might reasonably conduct a similar training…..
The most common reason for variation was the difference in organization of Election Day processes and materials, down to details such as color coding schemes or when to tear off a ballot stub. These procedural differences clearly stem from each county election department evolving its own way over the years and reflecting the style of its managers.23
Even the best training does not cover all contingencies. Poll workers are called on frequently to deal with situations to which the training they did receive is inapplicable and they must, therefore, make judgment calls. These exercises of discretion often lack consistency, a circumstance that is obvious to voters when they see poll workers guessing at what to do or when, as happens on occasion, they are asked by poll workers what to do in a particular situation. Although voters who are knowledgeable about election procedures may be willing to help, they may nevertheless be hesitant to challenge the judgment of poll workers who are nominally in charge of polling places. Wrong calls are made and in some cases voters suffer.24
Because the problems posed by poll workers to the quality of the experience voters have in California are clearly visible to the people who go to a polling place to vote, voters generally and first-time voters in particular are not going to feel comfortable voting or comfortable returning to a polling place to vote in future elections, unless the performance of poll workers is addressed.25
Unfortunately, because counties already have a difficult time recruiting and retaining an adequate number of poll workers, there is a reluctance to be critical about the work they do and, beyond this, a more general resistance to professionalizing the staffing of polling places. The resistance may stem from idealizing poll workers as volunteers in the service of democracy – even though poll workers are paid small amounts for their work. It may also come from an administrative reluctance to add employees to a county’s payroll. From the perspective of the voter, the key is to establish confidence that all voters are treated fairly in a voting process that is transparent, consistent, and secure.
-
Poll worker training reform efforts, 2004 - 2008
Several efforts have been made in recent years to build greater voter confidence in the recruitment, training, and retention of poll workers, particularly by addressing the lack of uniformity in training and the lack of consistency in polling place practices. In 2004, then-California Secretary of State Kevin Shelley published My Vote Counts: The California Plan for Voting in the 21st Century,26 a plan mandated under HAVA. It included a section describing how the state would spend any new federal dollars allocated to educate election officials and poll workers.
The HAVA plan outlined specific topics that ought to be covered in local poll worker training programs.27 It did not, however, take steps to eliminate the lack of uniformity in poll worker training and polling place practices across the state. Those issues were covered the following year in another report, this one produced by the Task Force on Uniform Poll Worker Training Standards.
The task force, established in legislation sponsored by the Secretary of State (SB 610, Escutia, 2003) took as its primary focus the creation of “a set of uniform standards to ensure that California’s poll workers are properly trained in administering voting, handling emergencies, and properly using their county’s election equipment [as well as] to provide instruction to poll workers in serving voters with a disability or who do not speak English as their primary language.”28
-
Poll worker training guidelines, 2006
As required by the 2003 legislation, the Secretary of State followed up these recommendations by publishing Poll Worker Training Guidelines in 2006. These guidelines were drawn from the Task Force report and EARC’s early research.
The guidelines are 28 pages long and cover topics such as voters’ rights to cast a ballot, the provision of help with voting equipment, assistance to voters with limited English proficiency, the accommodation of parents with children, the rights of voters with disabilities, the rights of poll watchers and the media, rights for new citizens and residents, the right to voter privacy, the limits of poll worker responsibilities and authority, election challenge procedures, voting system operation, voting security and vote-tampering prevention.29
The guidelines emphasize the importance of giving poll workers a clear sense of mission and of teaching them how to be sensitive to voters from all types of cultural backgrounds. They also stipulate that training involve a hands-on component and be offered on evenings and weekends.
There has been no follow-up assessment of the extent to which these 2006 guidelines are now incorporated into poll worker training materials in all counties. There has been some additional research, however, on how a select numbers of counties are complying with the guidelines.
-
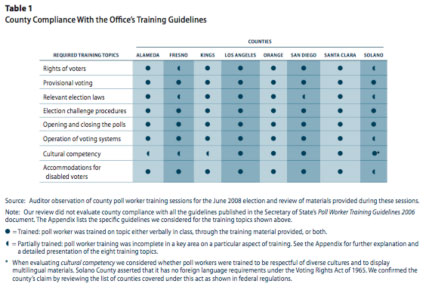
State Auditor’s report, 2008
In 2008, the California State Auditor issued a report on county poll workers at the request of the Joint Legislative Audit Committee.30 The State Auditor reviewed the poll worker training programs of eight counties and found that while the eight counties reviewed substantially complied with the content of the Secretary of State’s Poll Worker Training Guidelines, some counties appeared to train poll workers only partially in certain areas, such as cultural competency, rights of voters, and relevant election law. This finding is reflected in the following table excerpted from the State Auditor’s report.31
Despite all of these efforts and other recommendations that could be made,32 the poll worker problem persists. In response, a growing number of California counties are employing election day “rovers,” people who keep an eye on a number of polling places during the day to help troubleshoot problems that arise. This is particularly helpful when equipment fails or ballot supplies run low.
Online poll worker training programs are another new approach being used in some counties, such as Sacramento and Riverside. These programs are interactive, allowing poll workers to set up a virtual polling place online using their mouse, and reread training materials and rewatch videos on their own time. Since they can do all this without having to ask for assistance during a class, situations in training where poll workers feel embarrassed that they are not “getting it” and are reluctant to ask questions are avoided.
There is also the matter of resources to be considered. In California, poll workers earn about $100 for their work, which includes attendance at a pre-election training session and an election day that can last 16 hours with few breaks. Indeed, EARC’s research found that providing more pay, splitting shifts, and better screening of poll workers at recruitment were the most common improvements suggested by poll workers themselves. Some reassessment of how much Californians are willing to spend on staffing polling places is in order.
Voting by mail
Voting by mail in California, or what used to be referred to as “absentee voting,” has become much easier and much more prevalent in recent years. California voters can now sign up to be permanent vote-by-mail voters and automatically receive their ballots at home in the mail prior to an election. Voters can also sign up to be a vote-by-mail voter for a specific election.
The application requirements are the same in all counties and voters can complete and submit the application included in the county Sample Ballot to request a vote-by-mail ballot via fax or U.S. mail. Some counties also allow voters to request or update their vote-by-mail status online. The availability of this convenience, thus, depends on a voter’s county of residence.
There is also variation among the counties as to whether postage on a vote-by-mail ballot is required or covered by the county election office. In some counties, such as San Francisco, vote-by-mail ballots are “postage-paid.” In other counties, such as Sacramento, vote-by-mail voters must pay for the postage on their ballot. The amount of postage required can also vary due to the length of the ballot. For example, in the November 2008 election, a 42 cent stamp would not be sufficient to cover the postage costs for a Sacramento County vote-by-mail ballot because the length of the ballot resulted in extra weight; mailing the ballot required 59 cents in postage.33
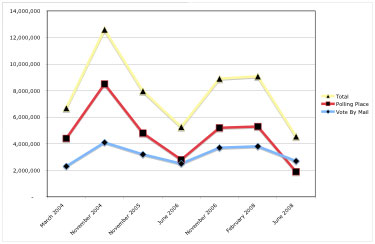
In recent years, the total number of vote-by-mail ballots has remained relatively
stable from election to election at between two and four million ballots.
Because of the wide variations from election to election in polling place
turnout, however, the percentage of all votes cast in a particular election
that are vote-by-mail ballots varies appreciably. Thus, over the past six
statewide elections, between March 2004 and June 2008, the number of vote-by-mail
voters has stayed within the two to four million range, with a high of 4.1
million in November 2004 and a low of 2.3 million in March 2004. By comparison,
polling place turnout is more volatile, ranging from a high of 8.5 million
in November 2004 to a low of only 1.9 million in June 2008.34
The California Voter Foundation’s 2005 voter participation study found that among California’s infrequent voters, 52 percent were not familiar with absentee voting and had never voted absentee. These findings indicate that the majority of infrequent voters – who also say that being “too busy” is their number one reason for not voting – are not taking advantage of a voting method designed to make voting more convenient and less time-consuming.
Returning a vote-by-mail ballot to a polling place
Vote-by-mail balloting necessarily relies on the U.S. Postal Service to process ballots in a timely fashion. The Postal Service offers no guarantee, however, about when a vote-by-mail ballot will be delivered from or to a county election office.
Ballots received by county election offices after polling places close are not counted, and counties routinely have piles of uncounted vote-by-mail ballots after every election. To have their votes counted, then, vote-by-mail voters have to watch the deadlines closely. While the last day to request a vote-by-mail ballot is, under state law, seven days prior to the election, the reality is that a voter who makes the request just before the deadline is not likely to receive that ballot and be able to return it by mail in time for it to be counted.
Vote-by-mail ballots can also be returned to polling places. Indeed, they can be returned to any polling place within the county. This convenience is not afforded to polling place voters, who must cast their ballots at the polling place to which they were assigned.
A vote-by-mail voter who misplaces his ballot can still vote at his polling place. He must show up at his local polling place, where his name appears on the voter rolls, which also indicate he received a vote-by-mail ballot. This enables the elections office to later verify that the vote-by-mail ballot was not in fact returned and prevent the possibility for the voter to vote twice.
The instruction for the poll worker is to give the voter a provisional ballot, a procedure that requires the voter to provide personal information and a signature on the outside of a provisional ballot envelope. This allows election officials to verify the voter’s status without viewing the ballot and retains the voter’s right to ballot secrecy. Provisional ballot envelope styles vary from county to county.
Voting early at the county election office or an early voting site
California voters can cast a ballot at their county election office anytime after vote-by-mail balloting begins (which is 28 days before Election Day). This is essentially “on-site early voting.” A voter shows up at the county election office, tells the staff where she lives, the staff person determines the voter’s precinct which in turn determines the voter’s ballot style, retrieves the correct ballot, gives it to the voter, and the voter completes it and returns it to the staff person on-site. This is a good option for voters who unexpectedly find themselves planning to be out of town on Election Day and do not have time to request, receive and submit a vote-by-mail ballot.
In addition to on-site early balloting at the county election office, some counties set up remote early voting sites in the weeks leading up to Election Day. In the June 2008 election, 16 of the state’s 58 counties reported to the Secretary of State that they were offering this kind of early voting to their voters.35 Electronic voting machines have historically been used at early voting sites so that all the ballot styles for the entire county can be stored in the machine and be available at the remote sites and as a way to test out new equipment.
Early voting programs require additional staff and extra security procedures to ensure that early voters do not cast ballots more than once at early voting sites, and that all early-voted ballots can be accounted for after the election. Recent additional security requirements mandated by the Secretary of State requiring one hundred percent hand recounts of all electronic ballots have curtailed early voting in some counties, such as Los Angeles.
The extent to which voters take advantage of early voting opportunities and whether county election staff find the programs cost-effective or useful are unknown. From the voter’s perspective, early voting adds to the variation from county to county in the way conveniences are offered to voters and makes the quality of the voting experience dependent on the discretion of local registrars of voters or boards of supervisors. From a statewide elections policy point of view this may not be desirable.
It also remains to be seen whether conveniences like early voting or vote-by-mail balloting substantially and consistently increase turnout, or simply make it easier for people to vote who would still vote without the convenient methods. Paul Gronke and his colleagues at the Early Voting Information Center at Reed College (2008) argue that:
“The empirical results to date have been relatively consistent: Convenience voting increases turnout but only modestly. The effects may be greater in lower-level contests, but these have not been examined by political scientists. More importantly, perhaps, convenience voting appears to exacerbate existing inequalities in the American political system, encouraging participation among those segments of the population who are already most likely to vote. These reforms retain voters who might otherwise not choose to vote in a lower-level contest, but they do not draw new voters into the system.”36
Other kinds of balloting – military/overseas voters
Californians living overseas or serving in the military vote under different rules and timelines than are applicable to most other voters. This is chiefly because of the difficulty in predicting how long it will take to return an overseas ballot for counting. After special Absent Voter Applications are mailed out two months prior to an election, overseas voters can speed the return process if they return their ballots by fax.
Doing this, however, compromises the right to a secret ballot. The voter’s name and ballot choices will be visible to whomever sees the faxed ballot, including in the case of a military voter other military personnel and perhaps a supervisor. Thus, military voters face a difficult choice. If they cast a secret ballot by mail, it may not be received in time to be counted. If they opt for the convenience and timeliness of returning a ballot by fax, the right to cast a secret ballot is lost and they may be subjecting themselves to pressure from others in the process.
There have also been efforts in recent years to allow overseas and military voters to cast ballots via the Internet. Some further experimentation with this method of voting for this particular class of voters will take place in Okaloosa County, Florida for the November 2008 election.37
Primary elections in California
Primary elections are the most confusing and complicated of all, for voters and poll workers alike. The time of year the election is held and the rules for participating change from year to year.
In 2004, for example, the primary election was in March. In 2006, the primary was in June. In 2008, California held two primaries -- a Presidential Primary in February and a state Primary for congressional and legislative contests in June. The rules for participating now constitute a semi-closed process in which political parties can choose whether independent voters can vote in their primaries. The parties can also impose rules that allow independent voters to vote in some primary contests but not others. In 2004, for example, the California Republican Party allowed independents to vote in all Republican contests except the Presidential and party central committee contests.
Another confusing factor in primaries for independent voters is the varying procedures in place for handling “crossover” voters, those independents who cast a partisan ballot. State law says that independent voters who wish to vote a partisan ballot must request one. For independent vote-by-mail voters, counties will send out a postcard notifying those voters they need to request a partisan ballot if they wish to vote one. But for independent polling place voters, the procedure differs from county to county, and even from polling place to polling place.
Some counties instruct their poll workers to be proactive and ask independent voters if they wish to cast a partisan ballot. Other counties, concerned that asking this question may itself appear partisan, rely instead on the voter to speak up, or they place signage in the polling place about requesting a partisan ballot. Regardless of the rules in place in any given county, some poll workers do or do not ask independent voters if they want a partisan ballot based on their personal judgment.
The net overall result is that voter educators and the media cannot give independent voters a precise or clear sense of what procedures to expect at their local polling place if they want to cross over and cast a partisan ballot.
The crossover process is confusing for poll workers, as well. All but two of California’s counties use paper ballots at polling places, and each polling place is provided with stacks of various ballots for each of the parties. Since the counties are expected to keep track of the number of crossover votes, there are different ballot styles for every independent combination possible.
Thus, one polling place in the June 2008 primary would have had ten ballot styles: one for each political party (6); plus one for each party allowing crossover votes (3); plus one for independents who do not wish to vote a partisan ballot. It is then the poll workers’ job to make sure each voter gets the correct ballot style. If this does not happen, independent voters may end up voting in contests in which they are not supposed to vote, according to the parties’ rules, and partisan voters may end up being deprived of a vote in contests in which they are entitled to cast ballots.
In Los Angeles County in the February 2008 Presidential Primary, 12,000 votes cast for President by independent voters were not counted due to a confusing ballot design. Independent voters who wished to vote in the Democratic party primary were required to fill in a bubble indicating that they were voting in the primary and then fill in a second bubble indicating their candidate of choice. Many voters overlooked the first bubble and simply filled in their choice.
This mistake was understandable in one sense, given that under the rules independent voters had to declare to poll workers their intention to cast a partisan ballot before obtaining a ballot and heading to the voting station. But according to the county’s registrar of voters, this was not the first election where that particular ballot design had been used. Only 41 percent of independent voters marked the party preference bubble in 2006, and only 44 percent marked it in 2004. In both of these prior elections there was a significant crossover undervote in the race at the top of the ticket, and one would think it might have been avoided in 2008.38
4. Results
Everyone who votes in an election wants to know how it turned out. Election results are typically announced in stages. There is, first, a “semi-official canvass” of the vote, which is usually released to the media and other interested parties, such as political campaigns, the morning following Election Day. Counties have 28 days after the election to finish counting all of the ballots, after which they can “certify” that their canvass of the results is complete. These certifications are then submitted to the Secretary of State and compiled into the official, certified “Statement of Vote”.
Online election results
Counties generally do a good job of making election results available online, both for the semi-official canvass and the certified results. The Secretary of State also makes results available online, often accompanied by colorful maps showing breakdowns of the vote by county on state ballot measures and statewide contests. Voters without access to the Internet have to rely on news reports to find out the results of elections.
Verifying the vote
During the 28 day post-election canvass period, county election officials must verify various ballots that were cast and count those that are valid. Provisional ballot envelopes must be checked and provisional voters’ voting status verified before their ballots are counted or disqualified. Vote-by-mail ballots received on Election Day must also be verified to ensure that no voters voted twice, which is possible because, as previously explained, anyone who requests a vote-by-mail ballot also has the right to request a ballot at the polling place if their vote-by-mail ballot is misplaced. The growing number of provisional ballots and vote-by-mail ballots returned to polling places slows down the vote counting process and raises the question of whether counties, particularly large counties, have enough time to perform all the duties required of them in the post-election period.
-
Post-election manual counts
The public is allowed to observe the canvass of the vote, as well as the post-election manual count. The latter is a process required by state law to verify the accuracy of vote-counting software. For the manual count, each county selects one percent of its precincts at random and tallies the ballots from those precincts by hand, in public, and then compares those results to the software-tallied results.
The method used for selecting precincts, the starting and ending dates of the manual count, and the number of counters in the process all vary from county to county. In some large counties the manual count takes several days or even weeks. So, although the manual count is supposed to be a public process, it is not actually feasible in some counties for voters to observe the entire process.
A recently-enacted state law requires counties to submit a report to the Secretary of State after each election giving the results of the manual count and explaining variations between the results tallied by hand and those tallied by software, if any exist. The Secretary of State’s office posts these reports on its web site.39 In the first election for which this reporting was required, however, that held in February 2008, only 23 of 58 counties submitted manual count reports. In the other 35 counties voters had no access to what is supposed to be an important election verification tool.
In an election environment where voting machines are so prevalent, the manual count verification process is arguably the most important activity in the post-election period. It guarantees transparency in a process that relies on proprietary software manufactured by private voting technology companies. It is a bulwark against the fear that voting technology companies could steal an election.
Against this is the reality that the manual count is conducted by election officials, who are essentially self-auditing their own work. Manual counts, then, are distinct from independent audits and could be appreciably strengthened if third parties had a larger role. As a recent Secretary of State’s Post Election Audit Standards Working Group report noted after comparing the key principles of financial auditing to those used in election auditing:40
Financial auditors are required to be independent of the entity (including management and key employees) being audited. The purpose of independence is to allow the auditor to be objective and to create confidence in the results of the audit. Ideally, independence in post-election auditing can be achieved by employing independent vote counters and audit supervisors who have the ability to escalate audit issues and discrepancies. The Working Group encourages the development of procedures that will build more independence into the post-election audit process… For example, vote counting in the post-election audit should be performed independent (i.e., “blind”) of the summary results, meaning the counters should not know the results of the initial count in advance of the manual count.41
And addressing specifically the independence of those doing the manual count, the Working Group observed that:
The following options can make manual counts more independent: 1) four-person counting teams, which can help catch misreadings of ballots; 2) hiring temporary help from the local community to count ballots, instead of using permanent employees; and 3) appointing community members rather than regular city or county employees to ballot inspection boards and manual count boards.42
The Working Group recommended that uniform statewide procedures for the conduct of the manual count would give observers a clear sense of how the process works and what to expect in any county where the process is taking place. This should include “procedures for chain of custody; requiring tracking of undervotes, overvotes, and cancelled Direct Record Electronic (DRE) ballots; blind counting; public reporting of discrepancies; and any escalation measures taken.”43
-
Provisional ballot verification
Above and beyond the right all voters have to a properly verified election, some voters are entitled to know whether their specific ballots were accepted, or not. Under the federal Help America Vote Act, provisional voters, for example, have the right to know if their provisional ballots were accepted. There is, however, no agreed or uniform method counties use to provide this assurance and there is not, therefore, any generally useful advice voter educators can give to provisional voters who want to find out what happened to their ballots.
-
Vote-by-mail ballot verification
Under a law enacted in 2006 and effective in 2008 (SB 1725, Bowen), vote-by-mail voters are also supposed to be able to determine the status of their ballots. The law requires counties as of March 1, 2008, to give vote-by-mail voters information online (or ask by telephone where there is no county election web site) about whether their ballots were received.44 The extent to which county election offices are actually meeting this requirement is unclear, especially in counties that remove such information from their web sites between elections. There are, however, three counties where vote-by-mail voters can look up this information online on a year round basis: Yolo, San Bernardino, and Santa Clara.45
-
Polling place ballot verification
Voters who cast paper ballots at polling places can verify that was accepted if they live in counties that scan ballots at polling places. Voters in “precinct scan” counties can correct their ballots if they overvoted in a contest or marked their ballot in a way that could not be read by the scanner. Voters who live in counties that do not have in-precinct scanners have their ballots counted centrally and do not have the opportunity to correct mistakes.46
For those Californians casting ballots on touchscreen or electronic voting machines, there is again variation by county. Orange and San Mateo counties, for example, use electronic voting machines for all polling place voters. Other counties place one electronic voting machine in each polling place to enable voters with disabilities to cast a secret ballot without assistance, as is required under state law and HAVA.
In counties where voters cast ballots on touchscreens there is the opportunity to verify a paper record of ballots before they are actually cast, and this is supposed to provide an independent check of the voting machine’s software. But there is a great deal of variation from county to county in what voters are told about the paper trail and how to use it to verify their ballots. And it is simply unclear whether voters who cast electronic ballots understand the purpose of the paper record or the assurance it ought to provide.
Long-term election results
Beyond the immediate post-election verification activities, there are longer-term election accountability issues that really ought to be considered. How are voters expected to measure the performance of politicians they elect to office? What is the policy outcome of initiatives that pass? When bonds are passed, are the public works projects they are intended to fund actually built? When a public policy is changed via the initiative process but is later challenged and thrown out by a court, how is a voter to find this out? There is no official follow-up on initiatives, which are plentiful in California and about which many voters think carefully before voting.
If voters are to feel the investment of time and effort needed to make informed ballot choices is a meaningful one, it would be useful to provide some public reporting and accountability as to the long-term outcome of initiatives and bond acts. Developing a nonpartisan method for assessing elected officials’ time in office might also be a helpful tool voters could use to evaluate their elected leaders’ performance.
Part III: Structural Impediments to Change
The Digital Divide
Many of the services provided to voters by counties and the Secretary of State are now provided online. The rationale for this is clear and straightforward. The Internet is a cost-effective way for government to supply information and services to voters, and an affordable and time-saving method for many Californians to access these data. It is, in fact, so economical and efficient that voters now have access to more information about voting and elections than they have ever had before.
These benefits of modern information technology are not equally shared, however. According to a 2008 PPIC survey,47 while three in four Californians use a computer at home, school or work, and half of Californians go online to visit government web sites, there is a persistent digital divide in California. Whites, blacks and Asians show a much higher rate of computer and Internet usage than do Latinos:
Race |
Computer use % |
Internet use % |
Whites |
85 |
81 |
Blacks |
83 |
82 |
Asians |
81 |
80 |
Latinos |
58 |
48 |
The same survey found significant income disparities among Californians using the Internet. While only 49 percent of Californians who earn less than $40,000 per year regularly access the Internet, this happens among 92 percent of Californians with annual incomes of $80,000 or more. There are also age differences. Internet use occurs among 78 percent of Californians between the ages of 18 and 34 but only among 58 percent of Californians age 55 and over.
The clear impetus in recent years among election reformers has been to provide more online information and services for voters. The findings of the PPIC survey suggest that this strategy does not help those voters most in need of assistance. The two segments of the population most chronically underrepresented in the electorate are Latinos and low-income Californians and they have relatively little Internet access. The one segment of the population that can be reached online and is currently underrepresented in the electorate is California’s young people.
Although the PPIC technology survey suggests that the Internet may be a less useful tool for reshaping the demographics of California’s voting population than some have hoped, the survey did find that another relatively new technology – text messaging – does hold promise:
Some experts have suggested that mobile devices may be the platform to bridge the digital divide because a phone and service plan costs less than a computer and Internet connection. In California, 75 percent of all adults and solid majorities in all demographic categories have cell phones. Whites (83%) and blacks (78%) are more likely than Asians (72%) and Latinos (63%) to have cell phones. Nearly six in 10 use their cell phones to send or receive text messages, and younger residents (87%) are the most likely to do so. They are also the most likely to use their cell phones for email or to access the Internet. Overall, one in four Californians uses cell phones for email (26%) or to go online (25%).48
The Staffing Issue
The number of people in the California Secretary of State’s office who work full time on elections issues is small -- remarkably small, in fact. The Elections Division has a staff of only 30. This means that rising public expectations for the Secretary of State to monitor and oversee county election offices, as well as to ensure the fairness and integrity of voting and elections in the state, are difficult to meet.
The staff of county election offices are also stretched thin. They have trouble meeting the reform mandates already enacted and they are usually, perhaps typically, except in the case of a few counties, reluctant to see additional mandates imposed.
Overall, election agencies at both the state and local levels have very little time for any big-picture analysis of California’s election process. The priority is always to prepare for the next election, just around the corner, and this constricts the window of opportunity for thinking about and implementing systemic and comprehensive change.
These staffing and workload problems are material contributors to the wide variations in election practices that now exist in California from county to county. If one county wants to begin an early voting program, for example, but another county cannot take on that additional responsibility, the practical and political solution has been to allow the county that has the resources to go forward but not impose a state mandate. This also has the advantage that the state does not have to fund the change. The downside of making public policy for voting and elections this way in a large and diverse state like California is such a deeply embedded and structurally endemic lack of uniformity in election practices that fairness and accountability are jeopardized.
Part IV: Ideas for Moving Forward
The need for uniformity and standardization in election practices and procedures
The institutionalization of diverse and non-conforming procedures and practices for voting and elections in California is now of such long standing and so pervasive that it represents a serious obstacle to change. It makes it difficult for people to see clearly what the problems are – even with the help of a relatively detailed guide such as this. And it gets in the way of developing consensus around reforms.
As preceding sections make clear, there is a lack of uniformity in voting and election practices across California’s 58 counties at every stage of the voting process. Clearly, some of this variation is a function of the several attempts made in recent years by state policy makers to make voting easier and more convenient for Californians.
Whatever their intended effects, these efforts have also had the inadvertent effect of making the voting process more complex and confusing for voters. No voter attempting to register, cast a vote, or understand election results can be exactly sure of what to do or what to expect.49 The other vitally important consequence of this bewildering complexity is a loss of accountability. When things go wrong, is it an accident or is someone trying to shape electoral outcomes by manipulating the process?
The development of uniform standards and procedures for election processes and polling place operations across the state could ensure a more predictable, positive, and consistent experience for California voters and provide a basis for holding election officials accountable. Greater uniformity would also make it easier for voter education groups to give voters accurate and precise information about what to expect from their experiences as voters. And it would reduce the workload on county election offices. The state would not want to move in this direction, however, without first reviewing and strengthening the state rulemaking methods currently being used to implement policy changes at the local level.
Establishing a voter participation goal
If California were to shape a more uniform voting process, it would likely help improve voter participation. Given acceptance of the proposition that a voter participation performance goal could give California voters, as well as those involved in elections policy and administration, a target to shoot for as they work together to improve the overall experience of California voters, who should be involved in developing a goal and what are the key issues they should analyze and discuss?
Constituencies, organizations and individuals to involve in further discussions to improve voter participation in California
-
Educators (for recruiting high school students as poll workers and for review of civics curriculum in California) and the Superintendent of Public Instruction
-
Systems experts (to review the organization of poll workers and polling places on Election Day)
-
Civic/voter education groups (to develop a shared strategy/goal for improving voter participation)
-
Funders/foundations (to develop a shared strategy/goal for improving voter participation)
-
Organizations that engage constituencies currently underrepresented among the voting public (young people, Latinos and low-income Californians)
-
Academics who study the election process
-
Election officials and experts at the state and local level
-
Poll workers
-
Officials from government agencies that play a role in the voting process, such as the DMV and the U.S. Post Office
-
Policy staff from the Legislature, Secretary of State and Governor’s office
Topics for further research
Turnout goals
-
Conduct a thorough analysis of California voter registration and participation trends and population demographics to be used to establish voter turnout goals.
Voter research
-
Survey California independent voters about voting in Primary elections. What percentage want to participate in partisan contests? How easy or difficult is it for them to participate?
-
Find out what percentage of Californians know the name of the county in which they live.
-
Research whether early voting and vote-by-mail balloting increase turnout among infrequent voters in California.
-
Conduct an analysis of the reports and complaints filed with the Secretary of State’s voter hotline (800-345-VOTE).
Voter registration
-
Research whether third-party registration data sections are completed on voter registration forms, what penalties are imposed if they are not completed, and how useful this data is in tracking down a problem with a form.
-
Consider what public policy changes could be made to reduce potential abuses by third-party voter registrants that infringe upon eligible voters’ voting rights.
-
Examine the security, privacy and public policy issues relating to establishing an online voter registration system.
-
Research the feasibility of providing uniform, universal access to voter registration forms at specific public locations, such as government buildings or commercial, chain establishments.
-
Study the DMV’s Motor Voter process to determine how it could be improved to ensure that new registrants make it onto the voter rolls.
Voter education
-
Assess the viability of establishing a project, perhaps at a university, to study the long-term outcome of initiatives on an ongoing basis and follow up on programs that were or were not implemented as a consequence of passage.
-
Develop a nonpartisan method for assessing elected officials’ time in office as a tool voters can use to evaluate the performance of their elected leaders.
-
Assess the scope, depth and effectiveness of civics education programs in California schools.
Voter Outreach
-
Research what kind of online activities would be effective in getting more young people involved with voting.
-
Assess the potential of implementing voter services that utilize text-messaging technology.
Poll workers and polling places
-
Study ways to address the poll worker shortage problem by finding new human resource pools from which to recruit.
-
Research effective recruitment and retention strategies.
-
Assess the effectiveness of high school poll worker programs and consider ways to expand them.
-
Assess the cost of poll workers and polling places and determine whether or how additional funding could improve California’s polling place operations.
-
Ask systems experts or experts in public administration to determine how to meet California’s poll worker and polling place needs.
-
Work with communication experts and graphic artists to develop standard, universal signage and to create a universal, California voting logo to improve the visibility of California’s polling places and provide voter outreach groups with a common cue to use across the state for informing voters how to spot their polling places.
County practices
-
Research how many provisional ballots and vote-by-mail ballots are accepted or rejected and why; set a goal to reduce that number.
-
Look at how counties are meeting the state law that gives vote-by-mail voters online access to find out if their vote-by-mail ballot was received.
-
Assess the effectiveness and cost of early-voting programs.
-
Look at how counties are meeting the HAVA requirement to inform voters who ask whether their provisional ballots were accepted.
-
Examine county voter outreach plans.
Procedures
-
Study the feasibility of creating uniform election standards and procedures across the state and examine how this uniformity could provide benefits to county election offices.
-
Examine the history and structure of the Secretary of State’s regulatory process to determine whether it can be used to implement voting policy changes.
Long-term reform
-
Research the history of California court reform and develop a strategy for mirroring the process that created the Commission on the Future of California Courts, which developed a successful blueprint for modernizing California courts in the early 1990’s.50
Acknowledgements
Many people have been extremely helpful and generous with their time in assisting with this paper. Special thanks are due to California Forward’s Zabrae Valentine, California Voter Foundation Board Chairman Geoffrey Wandesforde-Smith, Sacramento County Registrar of Voters Jill Lavine, Los Angeles County Registrar of Voters Dean Logan, California State Senate senior elections committee consultant Darren Chesin, Bonnie Glaser of the Election Administration Resource Center at UC Berkeley, and Dean Bonner at the Public Policy Institute of California. Thanks are also due to the numerous researchers and public policy experts whose work is cited throughout this paper.

1 Turnout would not be judged as a proportion of registered voters because
for reasons explained at length, below, registration itself can be a significant
barrier to participation in elections.
2 Excerpted from Public Policy Institute of California, Just the Facts: California’s
Likely Voters, (August 2008).
3 U.S. Census Bureau, “Voting and Registration in the November 2006
Election”,
www.census.gov/population/www/socdemo/voting.html.
4 By contrast, PPIC’s numbers includes all Latinos, whether citizens
or not. This is an example of how the data differs between the Census Bureau,
the Secretary of State, and survey research.
5 An example of another election problem that was improved by establishing
a performance goal is in the area of voting equipment. Following the 2000
Presidential election the U.S. public learned that many votes were not being
counted due to ballot layout and voting system design. Much research went
into this problem to determine which voting systems perform best to minimize
unintentional undervotes and overvotes. A blue ribbon commission, chaired
by former presidents Gerald Ford and Jimmy Carter, released recommendations
in 2001 for improving U.S. voting. Among the commission’s recommendations
was that states set a benchmark for voting system performance based on the
rate of overvotes and undervotes, also referred to as the residual vote rate.
The commission also suggested 2 percent as the rate for top of the ticket
contests. This benchmark and proposed rate gave policymakers, voting rights
advocates and others involved in this policy issue a powerful tool to use
when assessing a voting system and evaluating a jurisdiction’s performance.
6 James Irvine Foundation, New Experiments in Minority Voter Mobilization:
A Report on the California Votes Initiative (September 2007), online at http://www.irvine.org/publications/by_topic/caPerspectives.shtml.
A follow-up study, published in September 2008, is at http://www.irvine.org/publications/by_topic/caPerspectives.shtml#civic4 .
7 Ibid., page 42.
8 California Voter Foundation, California Voter Participation Survey Report
(March 2005), online at http://www.calvoter.org/issues/votereng/votpart/index.html.
9 The new form can be viewed online at www.sos.ca.gov/elections/votered/vrc_new.pdf;
and the old form at www.sos.ca.gov/elections/votered/vrc_old.pdf.
10 According to the Secretary of State’s office, unique voter registration
forms include a form for the “Safe at Home” program for victims
of domestic violence, the Department of Motor Vehicles’ form, a “New
Citizens” form, the Franchise Tax Board’s form, the Secretary
of State’s online voter registration form, and a student voter registration
form.
11 California Code of Regulations, Title 2 (Administration), Division 7 (Secretary
of State), Chapter 1 (Voter Registration), Article 3, County programs to
identify and register qualified electors, reads: All counties shall design
and implement programs intended to identify qualified electors who are not
registered voters, and to register such persons to vote, hereinafter referred
to as outreach programs.
12 Evan Halper and Michael Rothfeld, “Voters say they were duped
into registering as Republicans”, LOS ANGELES TIMES (October 18, 2008),
http://www.latimes.com/news/nationworld/washingtondc/la-me-fraud18-2008oct18,0,1499440,full.story.
13 http://www.sos.ca.gov/elections/elections_vr.htm
14 The counties offering online voter registration status lookups in the
November 2008 election include Alameda, Contra Costa, Los Angeles, Monterey,
Sacramento, San Diego, San Francisco, San Mateo, Santa Clara, Shasta, Solano
and Ventura.
15 Kim Alexander, “Rethinking Online Registration,” testimony
on behalf of the California Voter Foundation to the California Senate Elections
Committee, December 14, 2007, online at http://www.calvoter.org/issues/votingtech/pub/121407testimony.html.
16 In 2002, California voters rejected Proposition 52, an initiative that
would have established a statewide same day registration system.
17 The Public Policy Institute of California, Californians and their Future,
(November 2006) found that the official voter information guide and sample
ballot were viewed by voters as the most helpful sources of election information,
with 42 percent of voters saying these resources were most helpful.
18 http://www.calvoter.org/issues/votereng/parties/index.html.
19 California Voter Foundation, Map of California Voting Systems, online
at http://www.calvoter.org/issues/votingtech/currentmap.html
20 California Secretary of State, Election Day Observation Program Report;
June and November 2006 Elections (January 5, 2007), online at http://www.sos.ca.gov/elections/voting_systems/election_observer_report_complete_final.pdf .
21 Each county develops its own poll worker recruitment and training programs.
Poll worker payment levels are established and approved by county boards
of supervisors. State law (Election Code section 12309) requires inspectors
to be trained, but does not specify that training must happen before each
election. State law also does not require pollworkers other than inspectors
to have any training at all.
22 According to EARC researcher Bonnie Glaser, EARC’s research has
included discussions with all counties about poll workers, observing nearly
100 training classes in half the counties and working in various California
polling places on Election Day.
23 University of California, Berkeley, Election Administration Research Center, ”A
Snapshot of California Poll Worker Training in 2005,” (unpublished
report, 2006).
24 A 2008 study of voters and poll workers in Ohio conducted by researchers
at Brigham Young University and Kent State University found that voters’ evaluations
of poll worker performance closely matched poll workers’ confidence
in their training. “It is as if, consciously or unconsciously, pollworkers
communicate their sense of adequacy and preparation to voters as they interact
with them on Election Day. Voters can smell fear and uncertainty.” Ryan
L. Claassen, David B. Magleby, J. Quin Monson, and Kelly D. Patterson, "At
Your Service": Voter Evaluations of Poll Worker Performance, 36 AMERICAN
POLITICS RESEARCH 612-634 (2008).
25 In the 2004 election, over 3,000 problems and questions were collected
from California voters by the Election Incident Reporting System, an online
repository of election problems organized by election protection organizations.
California’s
2004 reports are online at 26 http://voteprotect.org/index.php?display=EIRMapState&tab=ED04&state=California .
26 California Secretary of State, My Vote Counts: The California Plan for
Voting in the 21st Century, (September 2003), online at http://www.sos.ca.gov/elections/hava_images/havaenglishplan.pdf.
27 According to this plan, the Secretary of State shall “ensure that
any training provided to poll workers covers at least the following topics:
• the proper operation and maintenance of voting systems and technology;
• the rights of voters to cast provisional ballots, the proper processing
and counting of those ballots, and how provisional voters can determine whether
their votes were counted and, if not, why not;
• The non-discriminatory application of HAVA’s identification requirements
for certain voters who register by mail;
• Identifying and assisting voters with disabilities, including psychiatric
disabilities, in order that such voters can participate fully in the voting
process independently and privately; (and)
• The rights of minority language voters in jurisdictions covered under
Section 203 of the Voting Rights Act of 1965 to receive language assistance
at the polling place”. (Ibid, pages 20-21.)
28 California Secretary of State, Task Force on Uniform Poll Worker Training
Standards, Final Report, (2005), online at http://www.sos.ca.gov/elections/pwt_taskforce/pwtf_final_report.pdf
The task force developed numerous recommendations, of which it cited the
following as the most important:
• “Poll worker training must include detailed information to ensure
that the rights of every voter are protected.
• Poll workers must be educated both on the authority of their role
as a poll worker, and the appropriate limits of that authority in order to
ensure no voter’s rights are infringed.
• Training must include instruction on the state election laws that
poll workers must follow on Election Day including poll worker duties, issuing
and receiving ballots, opening and closing procedures, how and when to issue
provisional ballots, and what constitutes intimidation of voters and corruption
of the election process.
• Poll workers must be instructed on the standard operating procedures
for their jurisdiction’s voting system including set-up, operation, and
dismantling the system. They must also be informed how to troubleshoot common
problems and how and when to request assistance for other problems.
• Each prospective poll worker must receive up to one hour of hands-on
training with the voting system they will use on Election Day. If a system
has more than one piece of equipment, poll workers must have hands-on training
on each piece of equipment.
• Instruction must be provided to poll workers on how to be respectful
and sensitive to the needs of voters with a disability, speak a language other
than English, or are from a background different than the poll worker.
• The Secretary of State, in conjunction with a public university,
should establish a statewide center to develop interactive training materials
and programs for poll workers and elections officials, and to provide guidance
to counties on improving how elections are conducted.”
29 http://www.sos.ca.gov/elections/poll_worker_training_guidelines_final_draft1.pdf
30 California Bureau of State Audits, County Poll Workers: The Office of
Secretary of State Has Developed Statewide Guidelines, but County Training
Programs Need Some Improvement (September 2008), online at http://www.bsa.ca.gov/pdfs/reports/2008-106.pdf.
31 Ibid., page 27.
32 Some of these other recommendations, which need much more debate and discussion,
include, in the author’s view:
• reduce the number of poll workers needed by consolidating polling
places and implementing “voting centers”;
• move to an all vote-by-mail voting process;
• utilize county employees and poll workers;
• have voting over multiple days to spread out the workload;
• set up voting shifts or establish poll closers (i.e. people who come
in for the evening shift and whose job it is to close the polls);
• create a uniform voting process in California using the same ballot
layout and voting equipment; and
• set up an accreditation program to ensure poll workers maintain current
knowledge of election laws and procedures.
33 See the Sacramento County press release of October 26, 2008, online
at http://www.elections.saccounty.net/coswcms/groups/public/@wcm/@pub/@vre/@shared/documents/webcontent/sac_016649.pdf.
34 After the June 2008 election, in which vote-by-mail ballots comprised
more than 50 percent of all ballots cast for the first time in a statewide
election, some experts suggested that this was further evidence that vote-by-mail
balloting has grown more popular. The reality is, however, that the number
of voters who vote by mail remains pretty much the same, while the number
who vote at polling places varies greatly. Moving to an all vote-by-mail
balloting system would likely reduce turnout for infrequent voters who show
up for major elections.
35 See chart at www.sos.ca.gov/elections/voting_systems/vsys_use_060308.pdf.
36 Paul Gronke, Eva Galanes-Rosenbaum, Peter A. Miller, and Daniel Toffey,
Convenience Voting, 11
ANNUAL REVIEW OF POLITICAL SCIENCE 450 (2008), online at http://arjournals.annualreviews.org/toc/polisci/11/1 .
37 http://www.operationbravo.org/
38 Los Angeles County Board of Supervisors, Meeting Transcript, February
6, 2008, page 102, Testimony of Los Angeles Registrar of Voters Dean Logan,
online at http://lacounty.info/BOS/SOP/TRANSCRIPTS/02-06-08%20Board%20Meeting%20Transcript%20(C).pdf.
39 These reports are available online at http://www.sos.ca.gov/elections/manual_count_reports.htm.
40 California Secretary of State, Post Election Audit Standards Working Group
Report,(July 27, 2007), online at http://www.sos.ca.gov/elections/peas/final_peaswg_report.pdf.
41 Ibid, page 6.
42 Ibid, page 24.
43 Ibid, page 2.
44 The Legislature considered and passed further changes in 2008 giving vote-by-mail
voters the right to find out online not only whether their ballot was received
but also if it was accepted or rejected (AB 2964, Levine). This legislation,
however, was vetoed by Governor Arnold Schwarzenegger. Counties could also
consider notifying vote-by-mail voters whose ballots are not counted that
this was the case. Those voters could then avoid making whatever mistake
they made that caused their ballot to be disqualified, such as failing to
sign the outside of the vote-by-mail envelope, which is required for ballot
verification and a frequent cause for vote-by-mail ballot rejection.
45 San Bernardino County: www.sbcounty.gov/rov/vbm/; Santa Clara County:
eservices.sccgov.org/absenteeballot/home.do; Yolo County: www.yoloelections.org/vbmdb.
46 The California Voter Foundation’s County-by-County Voting System
Directory shows which counties are using precinct count and central count
systems, online at http://www.calvoter.org/issues/votingtech/currentdirectory.html.
47 Public Policy Institute of California, Californians & Information
Technology, (June 2008), online at http://www.ppic.org/main/publication.asp?i=831
48Ibid, page 5.
49 In technology there is a principle known as the “KISS” rule,
which stands for “Keep it simple, stupid.” In elections, California
practices the anti-KISS rule. We have created an election process that is
grotesquely complex. A lawyer trained in election law who has practiced for
years would have a difficult time amassing the expertise and knowledge needed
to work in a California polling place without violating a single state law
or procedure.
50 See Commission on the Future of the California Courts, Justice in the
Balance 2020 (December 1993), online at http://www.courtinfo.ca.gov/reference/documents/2020.pdf
Site Map |
Privacy Policy | About
Calvoter.org
This page was first published on February
5, 2010 |
Last updated on
February 7, 2010
Copyright California Voter Foundation, All Rights Reserved.
