
California Voter Participation Survey
Survey Summary Report
- Right Direction Versus Wrong Track
- Most Important Reasons for Not Voting
- Barriers in the Voting Process
- Voting Attitudes and Experiences
- Most Important Reason to Vote
- Reasons People Don’t Vote
- The Time Barrier
- The Information Problem
- Registering to Vote
- Issues that Motivate People to Vote
- Election Day Holiday
- Election Information Sources
- Current Events Information Sources
- Demographics
- Party Registration
- Interview Language
Results from a survey of 2,145 infrequent voters and nonvoters in California reveal some of the barriers and motivations to voting among two distinct groups.
Detailed Findings
Right Direction Versus Wrong Track
When asked whether California is going in the right direction or is off on the wrong track, the more frequently the respondent votes, the more likely they are to say the state is going in the right direction. While the majority of frequent voters (53%) say the state is going in the right direction, and only 13% say they don’t know, only 40% of nonvoters say the state is going in the right direction, and 23%—almost double the amount for nonvoters—say they don’t know.
Right Direction / Wrong Track |
|||
Right Direction |
Wrong Track |
Don’t Know |
|
Nonvoters |
40 |
37 |
23 |
Infrequent voters |
50 |
33 |
17 |
Frequent voters |
53 |
34 |
13 |
Importance of Voting
Nonvoters are much more likely to say that voting is not that important. While 77% of infrequent voters say that voting is extremely or very important, only 47% of nonvoters agree. Conversely, more than one in four (26%) of nonvoters say that voting is not so important or not at all important, compared to just 3% of infrequent voters.
Importance of Voting |
||
Infrequent Voters |
Nonvoters |
|
Extremely important |
28 |
22 |
Very important |
49 |
25 |
Moderately important |
19 |
26 |
Not so important |
2 |
13 |
Not at all important |
1 |
13 |
Most Important Reasons for Not Voting
Being busy is the most cited reason for not voting for both infrequent voters and nonvoters. 28% of infrequent voters and 23% of nonvoters said that being too busy to vote was their most important reason for not voting or registering to vote. Lack of quality candidates was a main reason for both groups as well (20% for infrequent voters and 10% for nonvoters). The difficulty in getting the information necessary to vote was also a major reason for infrequent voters (9%), while the belief that voting does not make a difference was more significant for nonvoters (10%).
Most Important Reasons for Not Voting or Registering to Vote (nonvoters) |
||
Infrequent Voters |
Nonvoters |
|
I am too busy to vote |
28 |
23 |
There are no candidates that I believe in |
20 |
10 |
It’s too hard to get all the information I need to vote |
9 |
5 |
There are no issues that affect me |
6 |
2 |
I don’t remember to vote / I don’t remember how or where to register to vote |
6 |
7 |
Voting doesn’t make a difference |
3 |
10 |
Too many issues on the ballot |
2 |
3 |
My polling place moves constantly |
1 |
N/A |
Barriers in the Voting Process
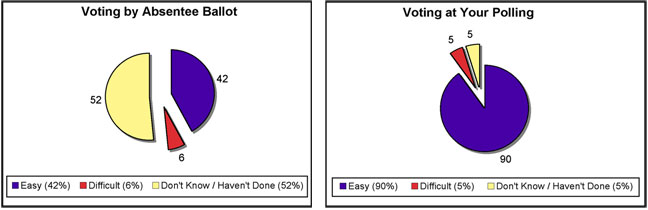
The logistical components of the voting process were described by infrequent voters as relatively easy, compared to the information-related components. Both gathering necessary information, and reading and understanding the ballot pamphlet were cited by one in five infrequent voters as “difficult”.
Although the logistical steps to vote were less challenging than the information-related parts, finding their polling place was still a problem for some voters, with 7% saying it was difficult.
Voting Process (Infrequent Voters) |
||||
Very Easy |
Somewhat Easy |
Difficult |
Don’t Know / Haven’t Done |
|
Reading and understanding the voter information pamphlet |
42 |
35 |
20 |
3 |
Getting the information necessary to make your voting decision |
48 |
29 |
20 |
3 |
Finding your polling place |
75 |
15 |
7 |
3 |
Voting by absentee ballot |
33 |
9 |
6 |
52 |
Voting at your polling place |
76 |
14 |
5 |
5 |
Registering to vote |
80 |
16 |
3 |
1 |
More than half of voters (52%) said they had never voted absentee, or didn’t know whether it was easy or hard. The majority of those who had voted absentee said that it was easy (42 of the 48% said easy), but a significant minority (6%) said it was difficult.
![]()
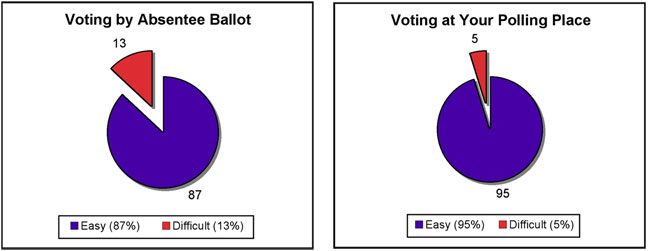
The following chart reports the results of only those who gave an easy or difficult rating for these questions. This excludes those who said they had never done the activity, or that they did not know. Of these respondents, 13% said voting by absentee ballot was difficult compared to just 5% who said that voting at your polling place is difficult.
![]()
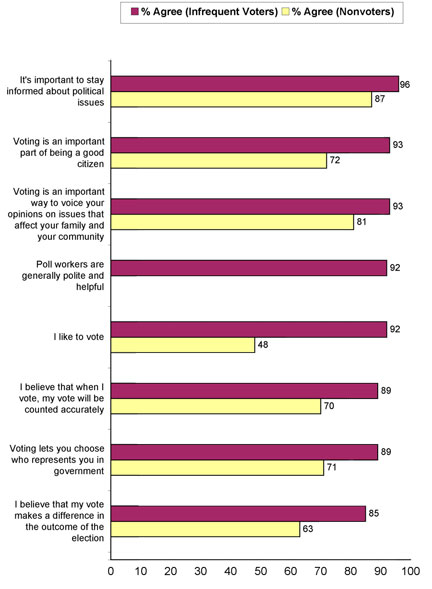
Voting Attitudes and Experiences
In every question, we see that positive attitudes toward voting are more common among infrequent voters, while cynicism is more common among nonvoters.
Infrequent Voters
Infrequent voters generally feel fairly positive toward voting, see the importance of staying informed and recognize their civic duty and the opportunity to voice their opinions through voting. Further, infrequent voters like voting; believe that votes are counted accurately; and believe that it can make a difference in the outcome of elections.
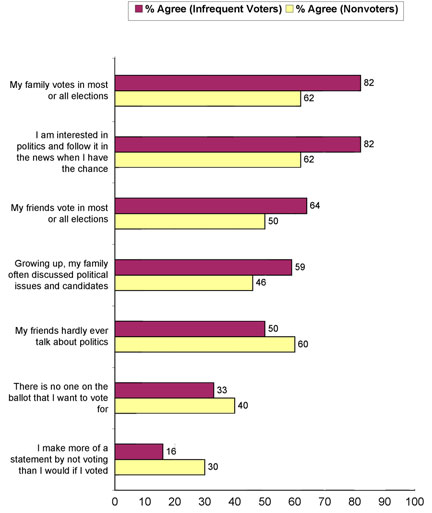
Infrequent voters follow the news. More than four in five (82%) say that they follow the news when they get the chance. However, infrequent voters do not live their lives immersed in a pro-voting culture. Although 82% say their families vote in most or all elections, only 64% say their friends do, and 15%, or almost one in six, say that they do not know if their friends vote. This is likely attributable to the one in two (50%) whose friends hardly ever talk about politics. Further, although respondents’ families do vote, 40% of infrequent voters did not grow up in families where political issues and candidates were discussed.
Only 40 percent of infrequent voters said there was no one on the ballot that they wanted to vote for, and 79% disagree with the sentiment that not voting makes more of a statement than voting.
Nonvoters
Nonvoters are more likely than infrequent voters to disagree with every positive statement and more likely to agree with every negative statement toward voting.
Although less than infrequent voters, most nonvoters still believe in the conceptual motivations to vote: it’s important to stay informed; voting allows you to voice opinions and choose your representatives; and voting is an important part of being a good citizen.
However, nonvoters are significantly more cynical about their vote being counted accurately (26% think it won’t) and that voting makes a difference (35% think it doesn’t).
The disparity between infrequent voters and nonvoters may best be revealed in the simple assertion “I like to vote,” which 92% of infrequent voters, but only 48% of nonvoters agreed with.
Nonvoters are even less likely to be surrounded by a pro-voting culture. Three in five (62%, and 20% less than the infrequent voters) say they follow politics in the news when they have the chance. Only half say that their friends vote in most elections, with 15% saying they don’t know if their friends vote. A strong majority, 60%, say their friends hardly ever talk about politics. The family of nonvoters is similar, with less than half saying their parents discussed politics growing up, and only 62% saying their family votes in most elections.
The higher level of cynicism is evident in the two in five who say there is no one on the ballot they want to vote for, and 30% who believe they make more of a statement by not voting than voting (compared to only 16% for infrequent voters).
Voting Experiences and Attitudes |
||||
Infrequent |
Nonvoters |
|||
Agree |
Disagree |
Agree |
Disagree |
|
It is important to stay informed about political issues |
96 |
3 |
87 |
12 |
Voting is an important part of being a good citizen |
93 |
7 |
72 |
24 |
Voting is an important way to voice your opinions on issues that affect your family and your community |
93 |
6 |
81 |
16 |
Poll workers are generally polite and helpful |
92 |
3 |
N/A |
N/A |
I like to vote |
92 |
7 |
48 |
41 |
I believe that when I vote, my vote will be counted accurately |
89 |
9 |
70 |
26 |
Voting lets you choose who represents you in government |
89 |
10 |
71 |
24 |
I believe that my vote makes a difference in the outcome of the election |
85 |
14 |
63 |
35 |
My family votes in most or all elections |
82 |
13 |
62 |
31 |
I am interested in politics and follow it in the news when I have the chance |
82 |
17 |
62 |
36 |
My friends vote in most or all elections |
64 |
21 |
50 |
35 |
Growing up, my family often discussed political issues and candidates |
59 |
40 |
46 |
51 |
My friends hardly ever talk about politics |
50 |
49 |
60 |
37 |
There is no one on the ballot that I want to vote for |
33 |
59 |
40 |
47 |
I make more of a statement by not voting than I would if I voted |
16 |
79 |
30 |
61 |
Most Important Reason to Vote
The most commonly named important reason to vote is expressing opinion and making one’s voice heard. Almost half (43%) of the infrequent voters and a third of the nonvoters cited it as their most important reason. Supporting a particular candidate is also named by a significant proportion of both groups, and one in ten nonvoters said the most important reason to vote is that you cannot complain unless you do.
Most Important Reason to Vote |
||
Infrequent voters |
Nonvoters |
|
Make your voice heard / express your opinion |
43 |
32 |
To support a particular candidate |
24 |
19 |
Civic duty |
9 |
9 |
To support a particular ballot issue |
6 |
5 |
Can’t complain unless you vote |
5 |
10 |
Something on ballot affects my family |
3 |
2 |
People struggled for the right to vote |
3 |
4 |
To oppose a particular candidate |
2 |
3 |
Pressure from family & friends |
1 |
1 |
Something on ballot affects pocketbook |
1 |
2 |
To oppose a particular ballot issue |
* |
1 |
As long as people don’t vote, government will be controlled by corporations/special interests |
* |
1 |
*Less than one percent
Reasons People Don’t Vote
Most infrequent voters and nonvoters do not vote because they feel that politics are controlled by special interests, the candidates do not appeal to them, and trusted information is hard to find.
The top reason that both voters and nonvoters do not vote in every election is that politics are controlled by special interests. Two-thirds of both groups agreed that was a reason they personally do not vote in every election. Candidates not really speaking to them was also a popular reason.
The difficulty of sifting through all the information available to make good decisions on how to vote followed. A number of other reasons related to the difficulty of using available information to make good decisions followed: too busy; issues are too confusing; too many things on the ballot; too hard to get information necessary; and distrust of the information available.
Belief that voting does not make a difference was a less popular reason among both groups, and the logistical barriers (figuring out where to vote, using voting equipment, comfort in the polling place, and poll workers) were the least commonly cited barriers to voting. However, it is important to note that although these reasons were less frequently cited, they are still significant. One in ten (11%) infrequent voters said that difficulty in figuring out where to vote was a reason that they don’t vote in every election.
Almost two in five nonvoters (38%) and 22% of infrequent voters agreed that their skepticism about their vote being counted accurately was a reason that they do not vote or register to vote.
Reasons People Don’t Vote |
||||
Infrequent |
Nonvoters |
|||
Agree |
Disagree |
Agree |
Disagree |
|
Politics are controlled by special interests |
66 |
28 |
69 |
23 |
I don’t feel that candidates really speak to me |
49 |
48 |
55 |
37 |
It is too hard to sift through all the information available to make good decisions on how to vote |
45 |
54 |
52 |
42 |
I am too busy with work or my family |
43 |
56 |
46 |
52 |
The issues are too confusing |
42 |
57 |
48 |
48 |
There are just too many things on the ballot |
37 |
61 |
44 |
44 |
I am just not interested in politics |
29 |
70 |
45 |
53 |
It is too hard to get the information necessary to make my voting decision |
25 |
75 |
34 |
61 |
I don’t trust any of the election information available |
24 |
74 |
36 |
58 |
I don’t believe that my vote will actually be counted accurately |
22 |
76 |
38 |
58 |
My vote doesn’t make a difference |
20 |
79 |
39 |
59 |
The results of elections just don’t have any effect on me personally |
19 |
80 |
29 |
68 |
It’s too hard to figure out where to vote |
11 |
89 |
18 |
79 |
The voting equipment is difficult to use |
9 |
88 |
13 |
61 |
Voting is an isolating and lonely experience |
8 |
91 |
13 |
74 |
I’m not comfortable in my polling place |
7 |
90 |
N/A |
N/A |
The poll workers are unfriendly or unhelpful |
6 |
90 |
N/A |
N/A |
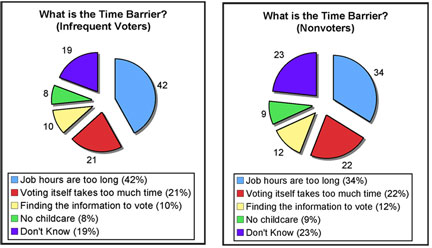
The Time Barrier
Respondents who said they are “too busy with work and family” were asked to further explain what underlies their time constraints. Long job hours were the most cited reason, with 42% of infrequent voters and one in three nonvoters citing it. About one in five of each group reported that voting itself takes too much time and about one in ten said that finding the information to vote takes too much time. Eight percent of infrequent voters and nine percent of nonvoters reported a lack of childcare as their main problem
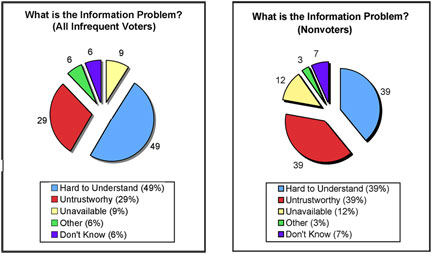
The Information Problem
The greatest problem with election information is that it is hard to understand, according to infrequent voters. Nonvoters feel that its untrustworthiness is just as much of a problem. Asked to choose between unavailable, hard to understand, and untrustworthy, 49% of infrequent voters and 39% of nonvoters said that being hard to understand was the greatest problem with information about elections. Information being untrustworthy was a greater problem with nonvoters (39%) than with infrequent voters (29%). Information being unavailable was named as the greatest problem by 9% of infrequent voters and 12% of nonvoters.
Registering to Vote
Nonvoters were asked to respond to a series of questions about their history of registering to vote. A number of barriers to registering to vote were cited by nonvoters. One in three (32%) said that they do not know where to find voter registration forms. One in four says they don’t want to register because they don’t want to get called for jury duty, and the same proportion say that they don’t want to register because they want to make sure that their information remains private. Almost one in five (18%) said that they thought they were registered through the DMV.
Almost half (44%) say they have been registered at some point before and 30% say they have filled out a voter registration form. One in four says it is difficult to stay registered because they move around so much.
Registering to Vote (Nonvoters) |
|||
Agree |
Disagree |
Don’t Know |
|
I know where to find voter registration forms |
68 |
29 |
3 |
I have been registered before, but not at my current address. |
44 |
53 |
3 |
I have filled out a voter registration form |
30 |
66 |
4 |
I don’t want to register because I don’t want to get called for jury duty |
24 |
73 |
3 |
I move around so frequently that it is difficult to stay registered |
24 |
74 |
2 |
I don’t want to register because I want my information to be private |
23 |
74 |
3 |
I thought I was registered through the DMV |
18 |
76 |
6 |
Issues that Motivate People to Vote
Education and the economy are the top issues that motivate people to vote, regardless of whether they are an infrequent voter or a nonvoter. Health care is also motivating for infrequent voters, whereas government and leadership is a more motivating issue for nonvoters.
It should be noted that only 8% of infrequent voters say that nothing would motivate them to vote, while 17% of nonvoters say the same.
Issues That Motivate People To Vote |
||
Infrequent Voters |
Nonvoters |
|
Education/Schools |
20 |
17 |
The Economy |
17 |
11 |
Health Care |
12 |
7 |
Government/Leadership |
12 |
13 |
War on Iraq |
10 |
7 |
Taxes |
9 |
6 |
War on Terrorism/National Security |
6 |
5 |
The Budget |
5 |
2 |
The Environment |
4 |
2 |
Immigration |
4 |
3 |
Crime and Public Safety |
3 |
3 |
Cost of Living |
3 |
4 |
Transportation, Roads and Freeways |
1 |
1 |
Growth, Development and Land Usage |
1 |
1 |
Housing |
1 |
1 |
Nothing would motivate me to vote |
8 |
17 |
Election Day Holiday
An Election Day holiday does not appear to have a significant effect on respondents. Nonvoters were somewhat more likely to say that it would make no difference in whether they vote (70%), compared to infrequent voters (64%). Of those who said they would be affected, slightly more respondents said that they would be more likely to vote than less likely to vote, but the overall increase in likelihood of voting was almost completely countered by those who said an Election Day holiday would make them less likely to vote.
Election Day Holiday |
||
|
Infrequent voters |
Nonvoters |
More likely to vote |
20 |
16 |
No difference |
64 |
70 |
Less likely to vote |
15 |
12 |
Election Information Sources
Among infrequent voters, conversations with family were the most influential information source. Almost one in three said they were very influential, and two in three said they were moderately influential. TV news was next, with 28% finding network news very influential, and 27% for cable news. Next was the local newspaper in English, followed by conversations with friends, radio, the Internet, and alternative media.
Political campaign ads on TV were the most influential campaign communication, slightly more influential than endorsements. Other campaign communication were the least influential information sources, with mail, radio, phone and volunteers at your door in descending order.
Election Information Sources (Infrequent Voters) |
||||
Very Influential |
Moderately Influential |
Slightly Influential |
Not At All Influential |
|
Conversations with family |
31 |
34 |
19 |
15 |
Cable TV news in English |
28 |
32 |
18 |
21 |
Network TV news in English |
27 |
37 |
20 |
15 |
Local newspaper in English |
25 |
40 |
19 |
15 |
Conversations with friends |
22 |
37 |
23 |
17 |
Talk radio |
19 |
30 |
17 |
32 |
Local radio news |
18 |
33 |
24 |
24 |
Internet |
17 |
23 |
15 |
41 |
Alternative media |
14 |
27 |
20 |
30 |
TV ads from a political campaign |
13 |
25 |
25 |
36 |
Endorsements from community groups |
11 |
30 |
25 |
30 |
Endorsements from public figures |
11 |
24 |
26 |
36 |
Mail from a political campaign |
10 |
23 |
26 |
40 |
Radio ads from a political campaign |
9 |
23 |
25 |
42 |
Phone call from a political campaign |
7 |
14 |
18 |
58 |
Volunteer at your door from a political campaign |
6 |
15 |
21 |
53 |
Current Events Information Sources
Television remains the most common information source, with 47% of infrequent voters and 56% of nonvoters getting most of their information from television. Infrequent voters were more likely to get their information from newspapers, the Internet, or the radio (44%) than nonvoters (33%).
Current Events Information Sources |
||
|
Infrequent voters |
Nonvoters |
Network TV |
24 |
27 |
Cable TV |
23 |
29 |
Newspaper |
21 |
18 |
Internet |
14 |
11 |
Radio |
9 |
4 |
Conversations with friends |
6 |
6 |
Alternative media |
2 |
2 |
Demographics
Nonvoters are disproportionately young, single, less educated, and more likely to be of an ethnic minority. 40% of nonvoters are under 30 years old compared to 29% of infrequent voters. Infrequent voters are much more likely to be married than nonvoters, with 50% of infrequent voters married compared to only 34% of nonvoters. 76% of nonvoters have less than a college degree, compared to 61% of infrequent voters, and almost twice as many nonvoters have a high school degree or less compared to infrequent voters. 60% of infrequent voters are white or Caucasian compared to 54% of nonvoters.
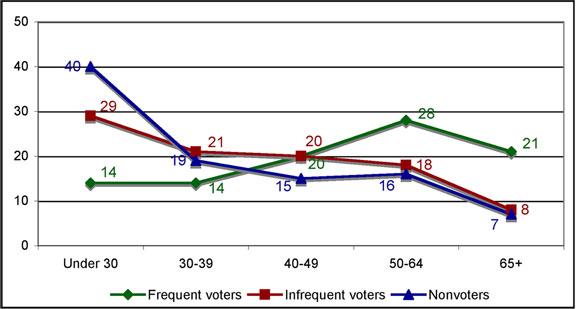
Age
Nonvoters are the youngest group, with two in five under 30 years old and a strong majority (59%) under 40 years old. Frequent voters are the oldest, with only 14% under 30 and 28% under 40. Almost half of frequent voters are over 50, compared to just 23% of nonvoters. Put another way, nonvoters are three times as likely to be under 30 as are frequent voters, and frequent voters are three times as likely to be over 65.
Infrequent voters are also young (50% under 40 and only 26% over 50), but are less likely than nonvoters to be under 30.
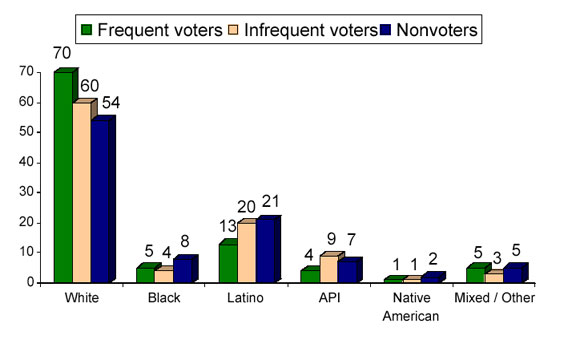
Ethnicity
Frequent voters are more likely to be white and less likely to be African American, Latino, Asian Pacific Islander (API), or Native American than are infrequent voters and nonvoters. While 23% of frequent voters are people of color (excluding mixed and other), 38% of nonvoters are people of color. Conversely, frequent voters are 70% white, compared to 60% of infrequent voters, and 54% of nonvoters.
Infrequent voters are more likely than nonvoters to be API, while nonvoters are more likely than infrequent voters to be African American or Latino.
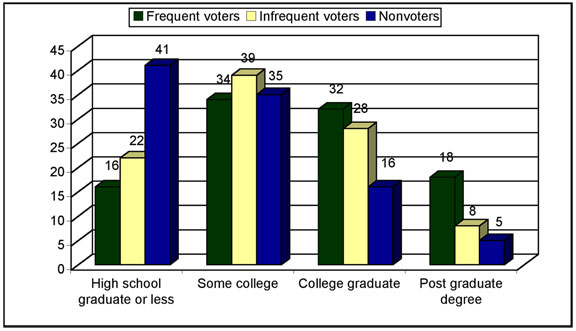
Education
One of the greatest differences in demographics between frequent voters, infrequent voters and nonvoters is education. More than two in five (41%) nonvoters are high school graduates or less, compared to only 22% of infrequent voters and 16% of frequent voters. By contrast, half of frequent voters have a college degree or more, compared to 36% of infrequent voters and only 21% of nonvoters. Frequent voters are almost four times as likely to have post-graduate degrees than nonvoters.
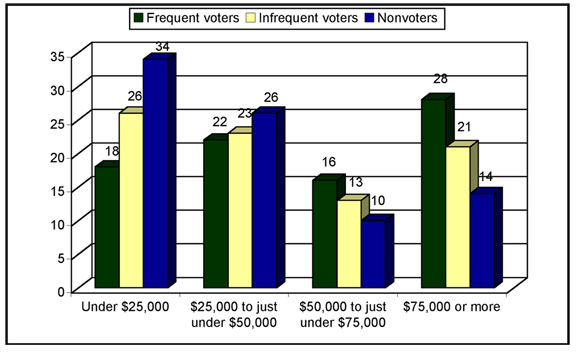
Income
Nonvoters make less money than infrequent and frequent voters. One-third of nonvoters make less than $25,000 a year compared to 26% of infrequent voters and only 18% of frequent voters. By contrast, 28% of frequent voters make more than $75,000 dollars a year compared to only 14% of nonvoters.
Employment and Transportation
Two in three (66%) infrequent voters and 60% of nonvoters work full-time or part-time. Nonvoters are more likely to be unemployed or retired (23% combined, compared to 16% combined for infrequent voters).
Employment |
||
|
Infrequent voters |
Nonvoters |
Employed Full-Time |
46 |
43 |
Employed Part-Time |
13 |
12 |
Unemployed |
8 |
11 |
Self-Employed |
7 |
5 |
Homemaker |
9 |
7 |
Student |
7 |
8 |
Retired |
8 |
12 |
Of those who work, more than half of infrequent voters and nonvoters work more than 40 hours per week, with only 9% working under 20 hours per week.
Hours worked per week |
||
|
Infrequent voters |
Nonvoters |
Under 20 hours |
9 |
9 |
20 to 30 hours |
14 |
14 |
30 to 40 hours |
21 |
21 |
40 to 50 hours |
36 |
37 |
More than 50 hours |
16 |
15 |
Nonvoters and infrequent voters have similar commute times. Of those who work, about half have a commute of under a half-hour; one in four has a commute of 30 minutes to an hour.
Average Length of Commute to Work |
||
|
Infrequent voters |
Nonvoters |
Under 15 minutes |
36 |
38 |
15 to 29 minutes |
26 |
25 |
30 to 44 minutes |
18 |
15 |
45 minutes to 59 minutes |
8 |
7 |
1 to just under 2 hours |
6 |
7 |
2 hours or more |
2 |
2 |
Work at home / telecommute |
3 |
3 |
Infrequent voters are more likely to drive a car to work (85% compared to 76% of nonvoters), while nonvoters are more likely to get a ride or use public transportation (13%, compared to 5% for infrequent voters). Almost one in four nonvoters does not have a drivers’ license.
Transportation to Work |
||
|
Infrequent voters |
Nonvoters |
I drive my own car |
83 |
74 |
I borrow someone else’s car |
2 |
2 |
I get a ride with a co-worker or friend |
2 |
7 |
I use public transportation |
3 |
6 |
I ride a bike or walk |
6 |
6 |
Valid California Driver’s License (Nonvoters) |
||
|
Yes |
No |
Valid California driver’s license |
78 |
22 |
Homeownership, Marital Status, and Children
Infrequent voters are much more likely to be homeowners than nonvoters, with half of infrequent voters owning their home, compared to 35% of nonvoters. Nonvoters are more likely to rent (41%, compared to only a quarter of infrequent voters). One in five infrequent voters and nonvoters lives with their parents.
Home Ownership |
||
|
Infrequent voters |
Nonvoters |
Own |
51 |
35 |
Rent |
25 |
41 |
Live with parents |
20 |
20 |
Other |
1 |
2 |
Half of infrequent voters are married, while only 34% of nonvoters are. Nonvoters are more likely to be single and divorced.
Marriage Status |
||
|
Infrequent voters |
Nonvoters |
Married |
50 |
34 |
Single |
31 |
40 |
Partnered |
5 |
8 |
Separated |
1 |
3 |
Widowed |
3 |
4 |
Divorced |
7 |
9 |
Infrequent voters and nonvoters are more likely to have children at home than are frequent voters. Almost 40% of infrequent voters and nonvoters have children under age 18 living at home compared to 32% of frequent voters. Of those who have children, 69% of both infrequent voters and nonvoters have children in public schools.
Children under 18 living at home |
|||
Frequent voters |
Infrequent voters |
Nonvoters |
|
| Yes | 32 |
39 |
38 |
| No | 67 |
59 |
60 |
Children enrolled in public schools |
||
Infrequent voters |
Nonvoters |
|
| Yes | 69 |
69 |
| No | 31 |
31 |
Internet Access
Infrequent voters are more likely than nonvoters to have access to the Internet in their home and in their work. 82% of infrequent voters have access in their home or at work, compared to 68% of nonvoters. Nonvoters are more likely to have no access at all to the Internet, with 20% having no access compared to only 12% of infrequent voters.
Internet Access |
||
|
Infrequent voters |
Nonvoters |
Home |
43 |
36 |
Work |
5 |
6 |
Both home and work |
34 |
26 |
Somewhere else |
3 |
9 |
Have no access |
12 |
20 |
Ideology and Religion
Frequent voters are more likely to be conservative than infrequent voters or nonvoters, while nonvoters are more likely to be liberal. Nonvoters called themselves liberal (35%, compared to 30% of frequent voters) most frequently, while frequent voters called themselves conservative (37%, compared to 30% of nonvoters) most often. Infrequent voters were in the middle, evenly divided 32% liberal, 32% moderate. Nonvoters are much more likely to not know their ideology.
Ideology |
|||
Frequent voters |
Infrequent voters |
Nonvoters |
|
Very Liberal |
9 |
11 |
13 |
Somewhat Liberal |
21 |
21 |
22 |
Moderate |
30 |
29 |
25 |
Somewhat Conservative |
21 |
22 |
20 |
Very Conservative |
16 |
10 |
10 |
Don’t Know |
2 |
4 |
8 |
There are no significant religious differences between infrequent voters and nonvoters. Infrequent voters and nonvoters are primarily Catholic and Protestant, with six to eight percent identifying with another religion, and one in five having no religious preference at all.
Religion |
||
|
Infrequent voters |
Nonvoters |
Catholic |
27 |
28 |
Protestant |
38 |
40 |
Jewish |
2 |
1 |
Muslim |
1 |
1 |
Buddhist |
3 |
2 |
Another Religion |
2 |
2 |
No Religious Preference |
20 |
21 |
However, nonvoters are more likely to never attend church, temple, or synagogue (35%, compared to 28% of infrequent voters, and 26% of frequent voters), while frequent voters are more likely to attend more than once a month (40%, compared to 37% of infrequent voters and 32% of nonvoters).
Church, Temple, Or Synagogue Attendance |
|||
|
Frequent voters |
Infrequent voters |
Nonvoters |
Never |
26 |
28 |
35 |
Once a month or less |
28 |
28 |
27 |
More than once a month |
40 |
37 |
32 |
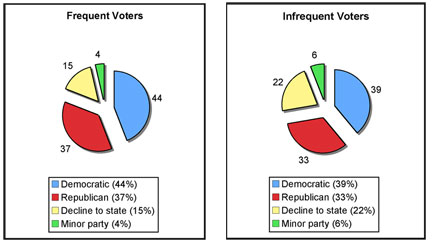
Party Registration
Infrequent voters are less likely than frequent voters to choose a party affiliation, and are more likely to decline to state their party preference or to affiliate with a minor party.
Interview Language
Interview Language |
||
|
Infrequent voters |
Nonvoters |
English |
92 |
97 |
Spanish |
5 |
1 |
Cantonese |
3 |
2 |
Site Map |
Privacy Policy | About
Calvoter.org
This page was first published on April
7, 2005 |
Last updated on
August 15, 2018
Copyright California Voter Foundation, All Rights Reserved.